Data Description
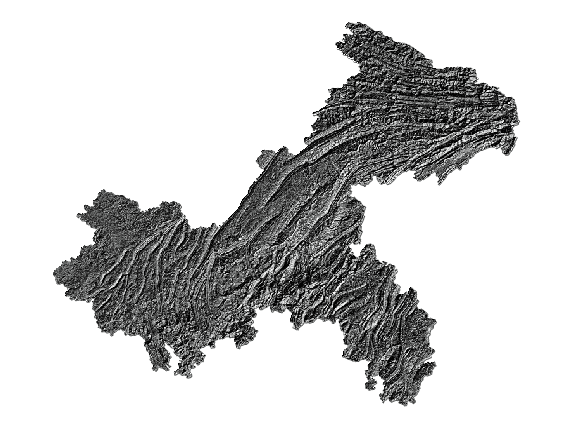
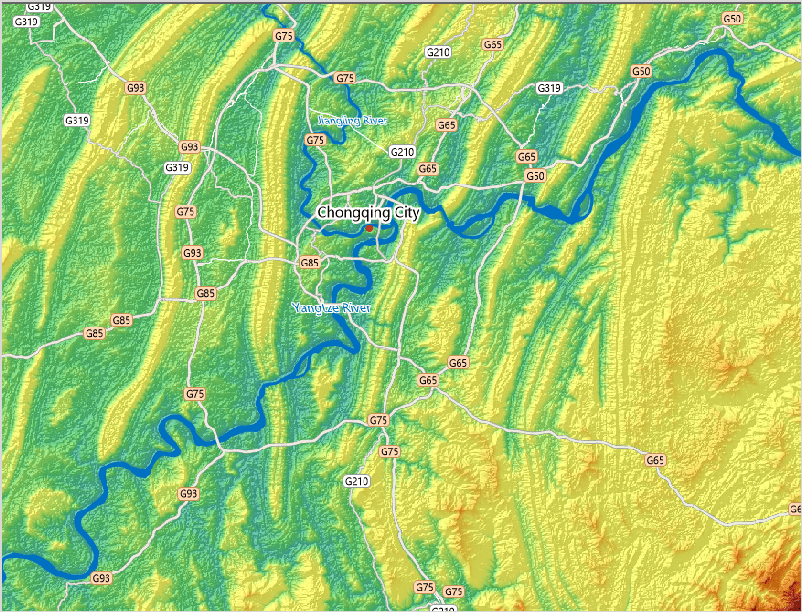
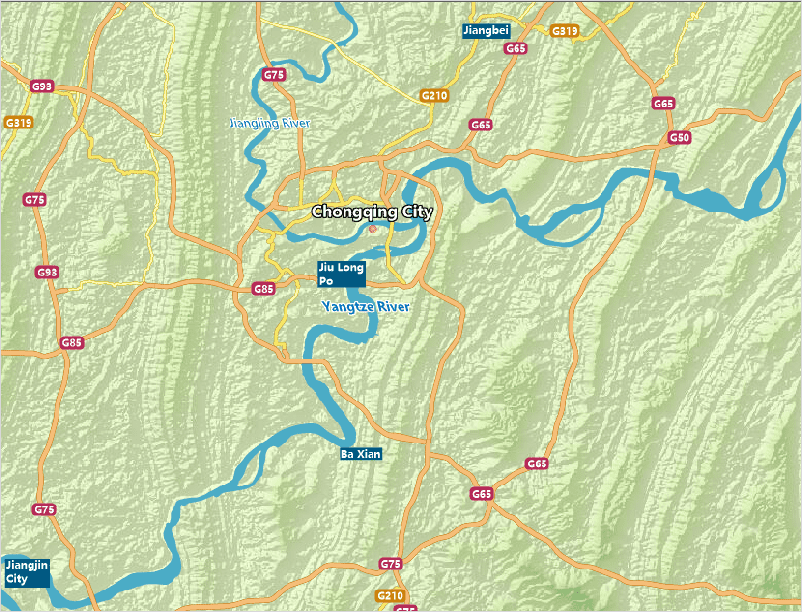
Chongqing 3D Hillshading Map has stereoscopic effect, it can directly reflect the terrain while describing the association of elements distribution between terrain, water and roads.
Data introduction:
The DEM data is from the SRTM DEM 90m resolution original elevation data in “Geospatial Data Cloud” website.(URL is http://www.gscloud.cn/). The vector data is from the data of public version 1:1000000 produced by national administration of surveying, mapping and geoinformation.
The data in the datasource is described in detail below.
| Dataset name | Dataset types | Data classification | Detailed descriptions |
|---|---|---|---|
| DEM | Raster dataset | none | Chongqing elevation data |
| Hillshade | The hillshade data created by using Chongqing DEM | ||
| ChongQing_P | Point dataset | Name | Chongqing |
| County_P | Chongqing County | ||
| MainRoad0_L | Line dataset | Traffic Line | Highway |
| MainRoad1_L | Overpass and expressway | ||
| MainRoad2_L | National road | ||
| MainRoad3_L | Provincial road | ||
| MainRoad4_L | Other main roads | ||
| MainRoad5_L | Secondary road | ||
| ChongQing_R | Region dataset | Administrative region | Chongqing contour region |
| MainRiver_R | Water | Main river, Yangtze | |
| River_R | Other rivers, including Jialing river and Wu river | ||
| Buffer1_R | Other region elements | The auxiliary region as the map ribbon | |
| Buffer2_R | The auxiliary region as the map ribbon |
Data processing
- Importing data
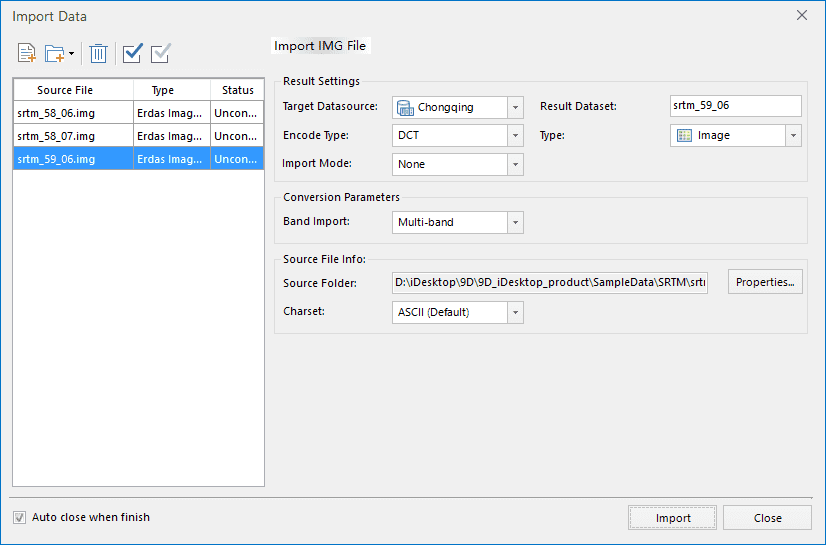
New file database, importing the DEM block data downloaded from the Geospatial Data Cloud site as a raster dataset.
- Data processing
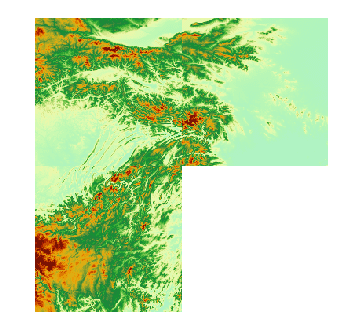
(1)DEM mosaic
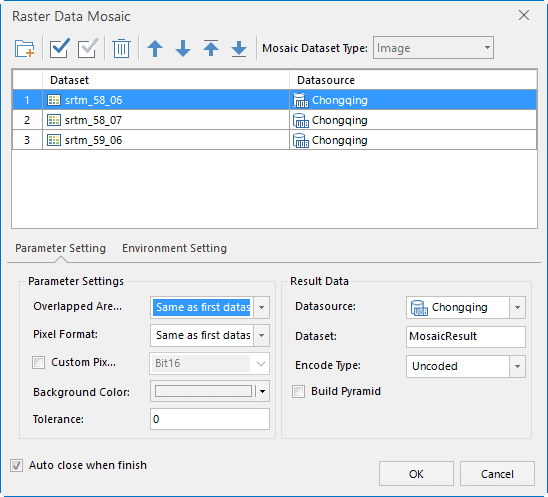
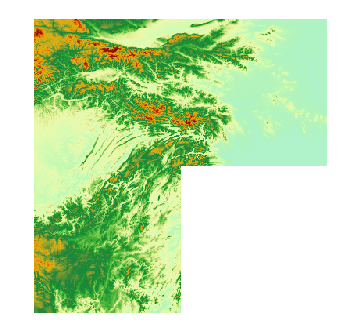
As the DEM data downloaded into Chongqing is divided into three pieces, so the DEM data should be spliced, use the tool in Data > Data Processing > Raster Mosaic for DEM data splicing.
|
|
|---|
(2)DEM Clip
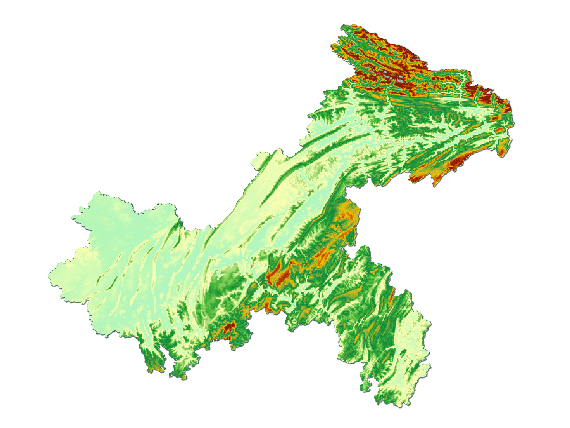
Importing Chongqing vector image data, using the tool in Map > Map Clip > Objects to clip the Chongqing DEM data.
Mapping process
- Generating hillshade map
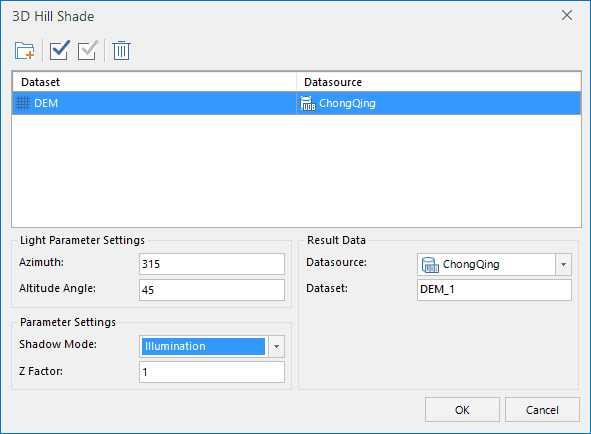
Using the tool in Spatial Analysis > Surface Analysis >3D Hillshade Map to generate Chongqing Hillshade data.
- Configuring color
Setting color table for the generated hillshade raster data, in general the color scheme selected is from black to white.
- DEM overlaps with Hillshade
In order to make the shadows has a three-dimensional effect and is rich in color, superimposing the DEM data over a Hillshade, setting a certain transparency for DEM data, and adjusting the transparency, brightness and contrast between DEM and Hillshade. Due to the large amount of data, the map after superimposing the DEM data over a Hillshade generates a image dataset, setting the resolution consistent with DEM for the higher fluency when browsing a map.
- Adding other elements
Adding the elements that includes rivers, roads, administrative divisions, etc., and setting the display scale corresponding with different elements layer to make the Hillshade displays different contents in different scales.
Map display
Note
You can set that the different parameters can generate different shadow effect when generating the Hillshade data.
- The range of the sun azimuth is clockwise 0-360, the range of the height angle is 0-90. The default values for the azimuth and height angles are 315 and 45, respectively, it is the position of the sun in the afternoon in winter. If you want the effect of summer noon, you can set the azimuth and height angles to 225 and 90 respectively.
- The elevation scale is the vertical scale factor, which determines the fineness of the mountain ridge line. The larger the value, the more prominent the ridge line is, the default is 1.
