Introduction
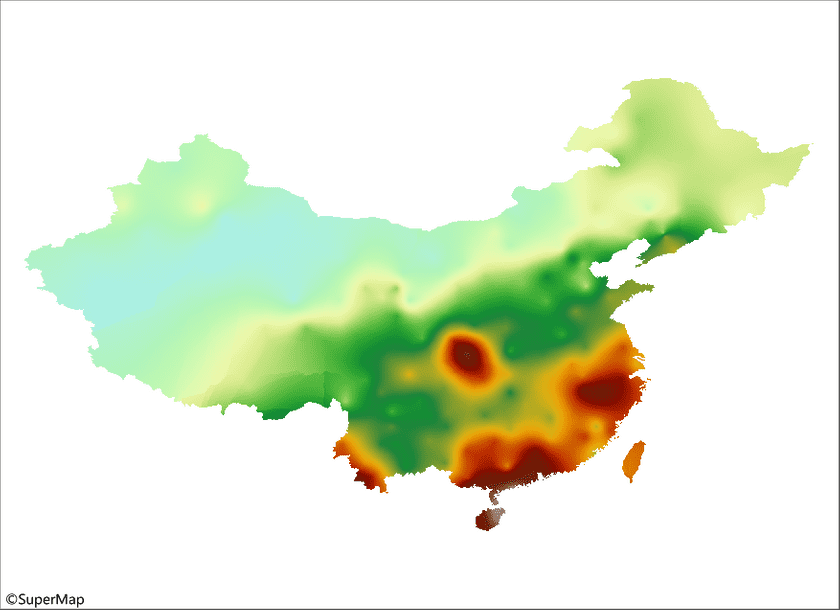
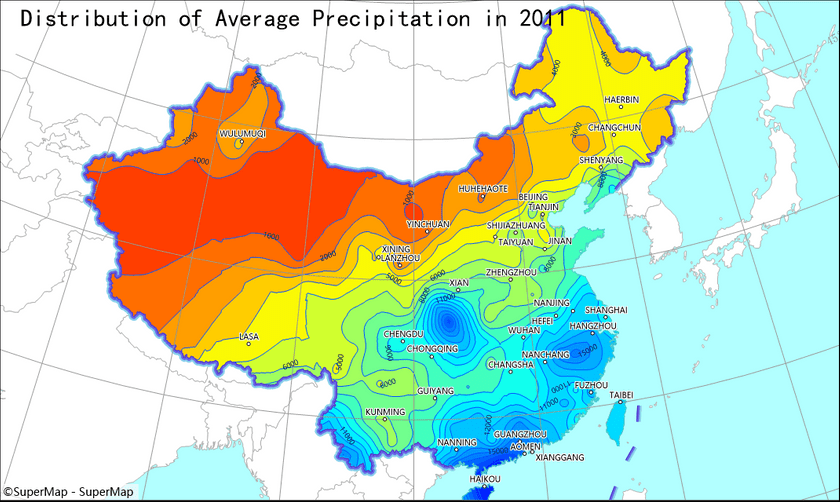
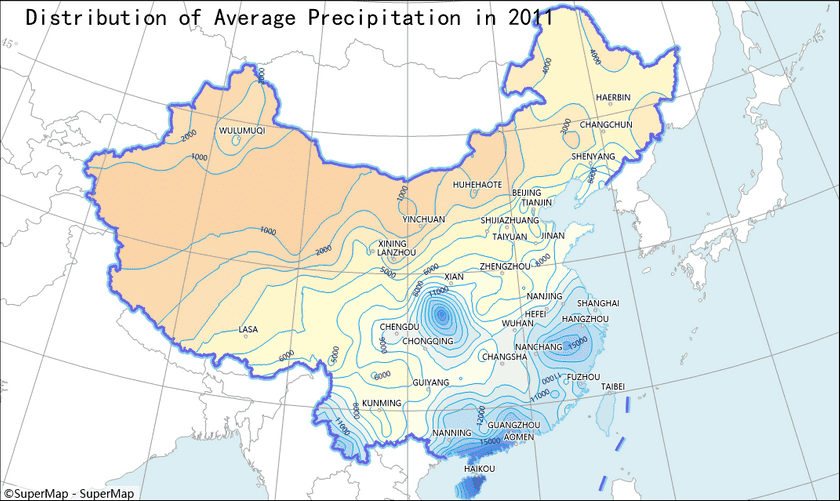
The average precipitation maps for 2011 reflect the difference in precipitation distribution across the country,map 1 is used with the Chinese meteorological data network consistent ribbon, the overall style is relatively bright, the effect of Figure 2 is a relatively soft color scheme.
Data Description
The original data (including the site description data and the monitoring results data) is the Excel format downloading from China Meteorological Data Network (url: http://data.cma.cn/site/index ), other data is from the data of public version 1:1000000 produced by national administration of surveying, mapping and geoinformation.
The data in the datasource is described in detail below:
| Dataset Name | Dataset Type | Data Classification | Detailed Description |
|---|---|---|---|
| Precipitation | Raster dataset | None | The interpolation result |
| WeatherStation_P | Point dataset | Thematic elements | The data of weather monitoring station |
| ProvinceCapital_P | Administrative point | Provincial capital point | |
| Border_L | Line dataset | Administrative boundary | Border |
| Coastline_L | Coast line | ||
| Precipitation_L | Thematic elements | Isolines of precipitation | |
| Country_R | Region dataset | Administrative region | Regions of all countries in world |
| BorderBuffer1 | Auxiliary elements | Region buffer of border for making map ribbons | |
| BorderBuffer2 | Region buffer of border for making map ribbons | ||
| Precipitation_R | Thematic elements | Isoregion of precipitation | |
| Island_R | Other region element | Island | |
| Elements | CAD dataset | Auxiliary elements | Name and legend |
| MapGrid | The graticules of China and the surrounding areas. |
Data processing
- Importing data
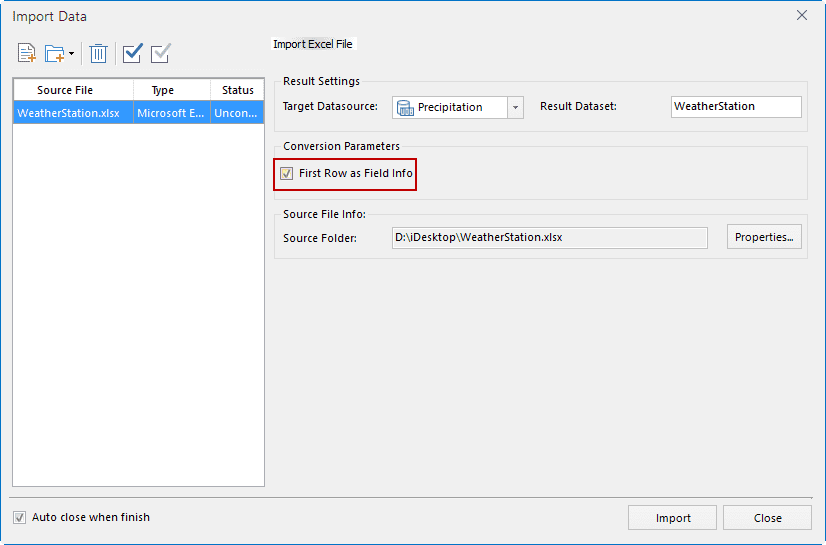
New a file database, and then importing the site description data and the monitoring results data downloaded from China Meteorological Data Network in the form of a property table into the database. Note: checks “First Row is as Field Info”.
- Data processing
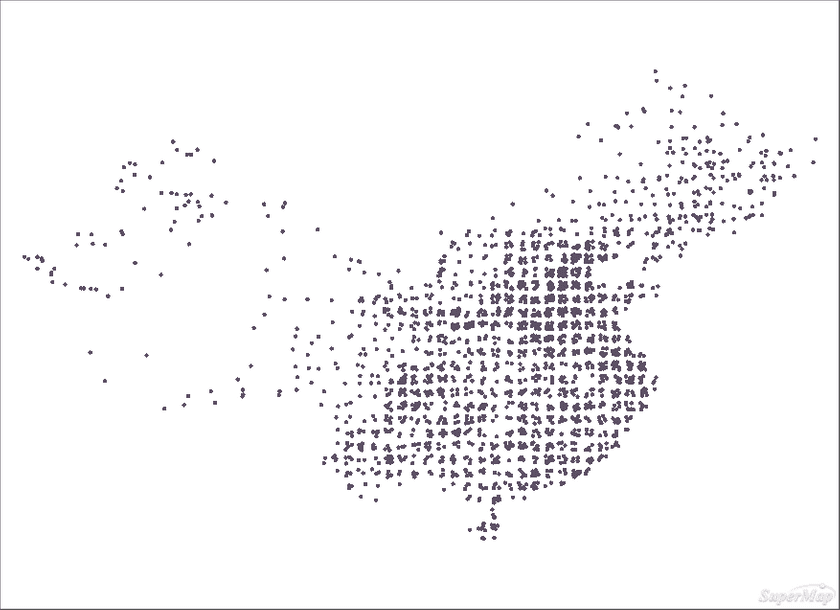
(1)Converting the site description data to a point dataset. Due to the downloaded data is Excel, you need to convert it to a point data when you import the data in an attribute table. You can click “Data” > “Tool” > “Data Convert” > “Attribute to Point” to convert the data. The x coordinate is longitude and the Y coordinate is latitude.
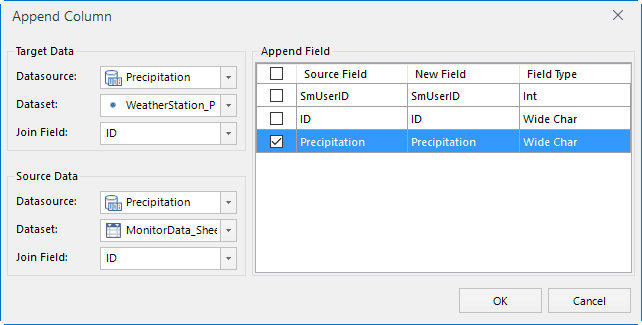
(2)Append attribute data. The average precipitation data in the monitoring result data is updated to the monitoring site attribute table in the form of appending an attribute column,through the function “Data” > “Data Processing” > “Append Column”.
(3)Interpolation analysis. Since the monitoring data of weather stations belong to sample monitoring, it is necessary to use the interpolation method to generate the grid to get the approximate value of the non-monitoring site area, using the fuction “Analysis” > “Raster Analysis” > “Interpolation Analysis”. Due to the result of the raster analysis is rectangular, the extracted isoregion is also a rectangular contour, so it needs to be clipped.
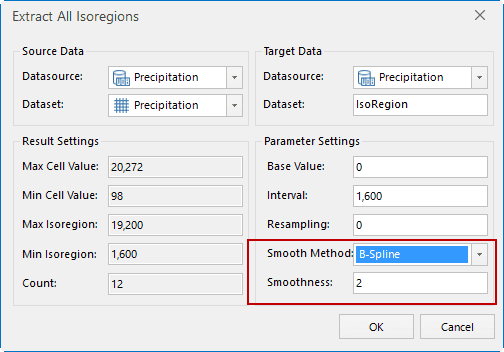
(4)Ectracting the isoregions of precipitation. Extracting the isoregions in the areas by the generated raster through using “Analysis” > “Raster Analysis” > “Surface Analysis” > “Extract All Isoregions”. In the case of the result data of the raster analysis with high resolution, the boundry of the isoregions may have more edges and corners. For the drawing effect, the appropriate smoothing coefficient can be set to smooth the edge.
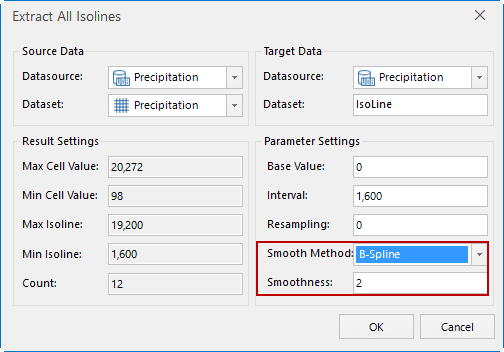
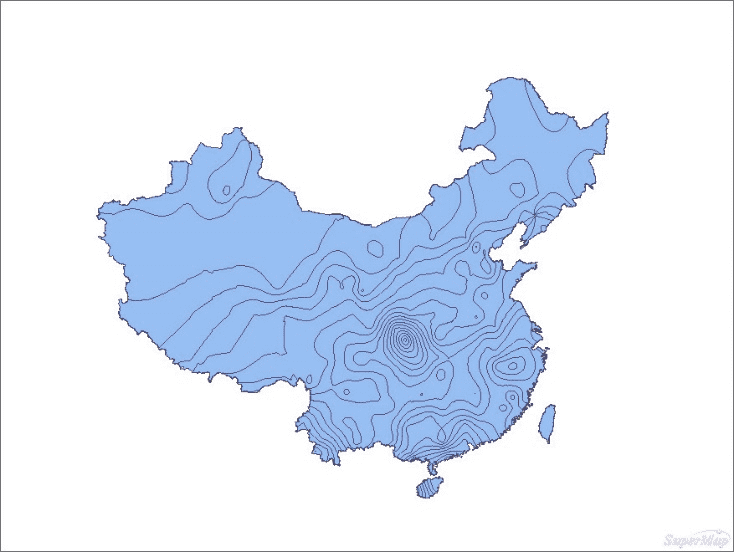
(5)Extracting the contours of precipitation. Extracting the contours of precipitation corresponding with isoregions through using the function “Analysis” > “Raster Analysis” > “Surface Analysis” > “Extract All Isolines”. The same parameters should be used for isoregions and isolines to make the edge of isolines and isoregions exactly match.
|

|
|---|
Drawing process
- Configuring administrative elements
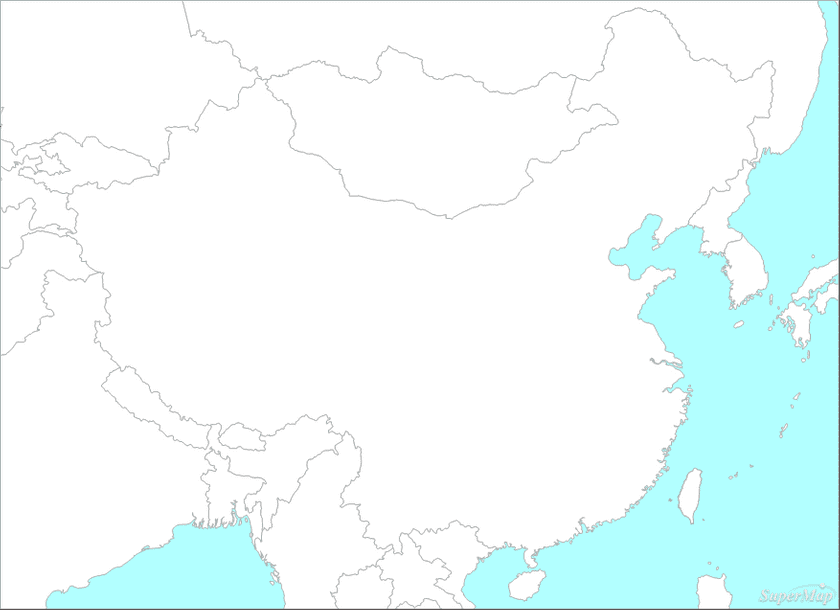
Adds the regions of countries in world, setting the background color of map are light blue because of other parts are water area.
- Producting the ribbon for China border
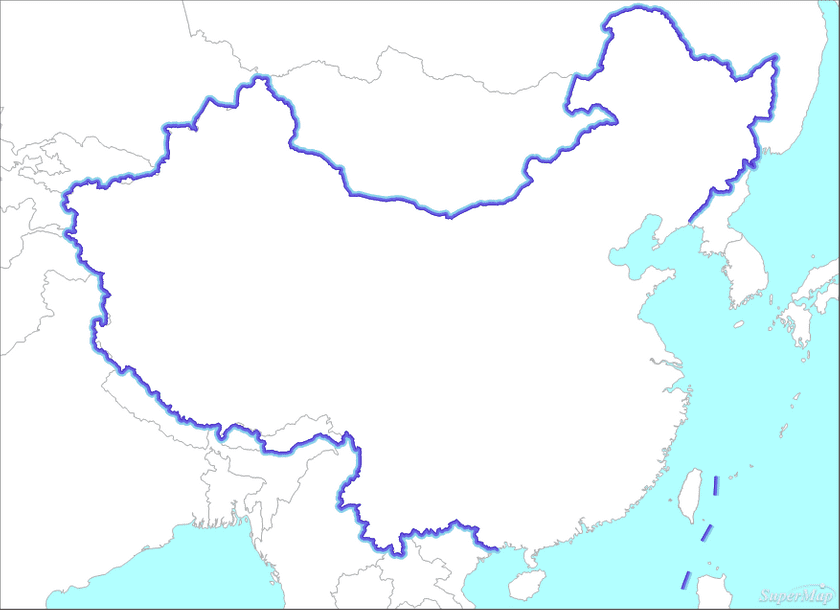
Create a ribbon for the map by making multiple unidirectional buffers and setting the same color with different saturation to produce the ribbon for map. Using the function “Analysis” > “Vector Analysis” > “Buffer” to generate the buffer.
- Producting the precipitation thematic map
Taking annual average precipitation as the expression to make a unique thematic map for precipitation isoregionis, and selecting an appropriate color scheme.
- Adds isolines of precipitation
Addind precipitation isolines and creating a label themematic map, in order to make the picture elements more comprehensive and rich, so that readers can clearly distinguish a precipitation region where the area is in.
- Adds auxiliary elements
Adds names.
- Create a map grid
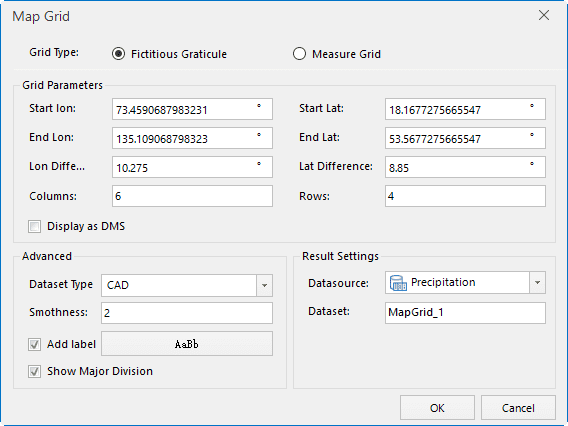
Since the distribution of precipitation is closely related to the geographical location of the area, the graticule needs to be added for the map by clicking “Map” > “Map Grid”.
- Setting the full range for map
After completing the configuration of map, the full range of map will display the area of world. But for this map, the world is only auxiliary expression content, focusing on the scope of China. Check “Custom Full Bounds” in the “Bounds” of “Map Properties” to set China area is the full range.
