Data Description
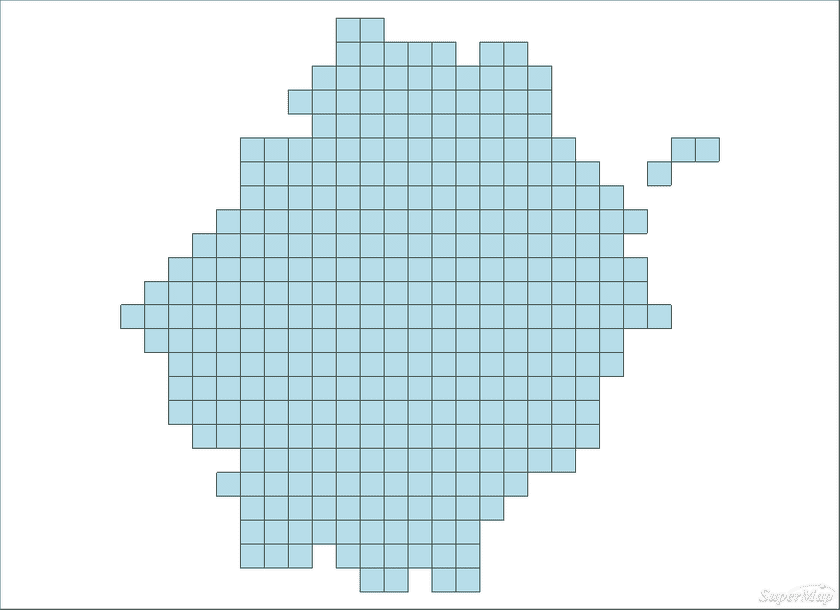
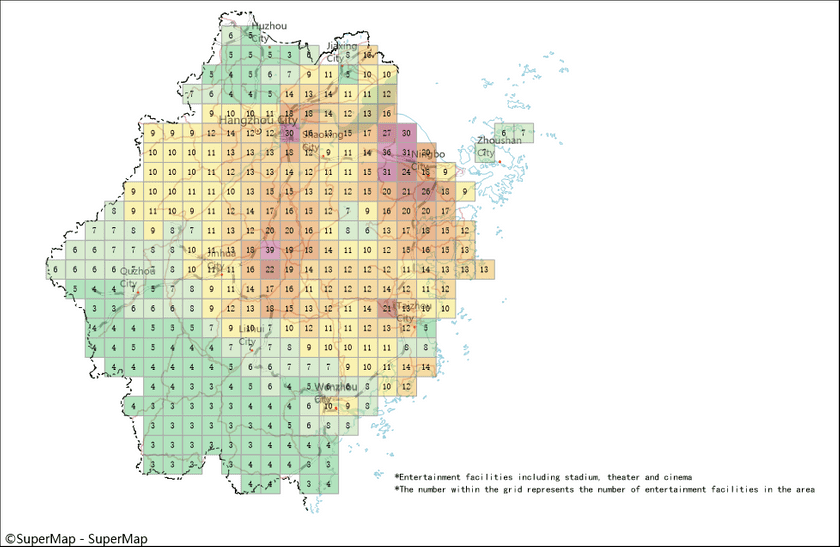
The map reflects the distribution of cultural venues in different areas of Zhejiang through hot grid map. The province is divided into 20000m * 20000m grid. Setting the color gradient for different grids to make the map gradient layers intuitively, at the same time highlighting the detail number of venues that every grid represents through mark to make sure the data integrity.
Data Description
The number of venues is from Zhejiang Statistic Information (url: http://www.zj.stats.gov.cn/), other data is from from the public version 1:1000000 data produced by national administration of surveying, mapping and geoinformation.
The data in the datasource is described in detail below.
| Dataset name | Dataset types | Data classification | Detailed descriptions |
|---|---|---|---|
| Facilities | Raster dataset | Thematic Elements | The raster generated by interpolating the number of venues |
| ProvinceCapital_P | Point dataset | Administrative point | Provincial City |
| CityA_P | Other cities | ||
| County_P | County | ||
| Province_L | Line dataset | Administrative line | Provincial boundaries |
| Coastline_L | Coast Line | ||
| StateRoad_L | Traffic line | National Road | |
| ProvinceRoad_L | Provincial Road | ||
| Railway_L | Railway | ||
| Province_R | Region Dataset | Administrative region | province Region |
| River_R | Water system region | River | |
| Lake_R | Lake | ||
| Facilities_R | Thematic elements | The region converted from the raster which is generated by executing the Interpolation Analysis for the avenues number. | |
| FacilitiesElements | CAD dataset | Auxiliary elements | Explanatory text |
Data Processing
- Interpolation analysis
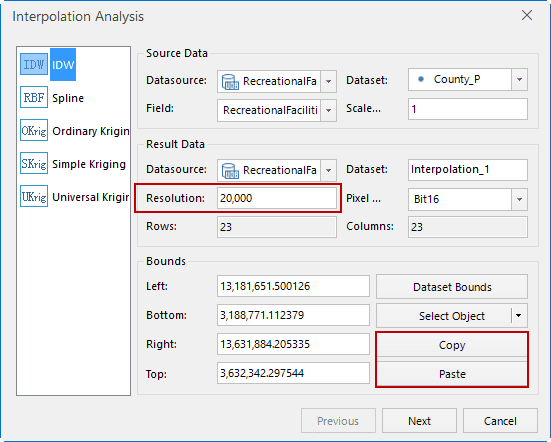
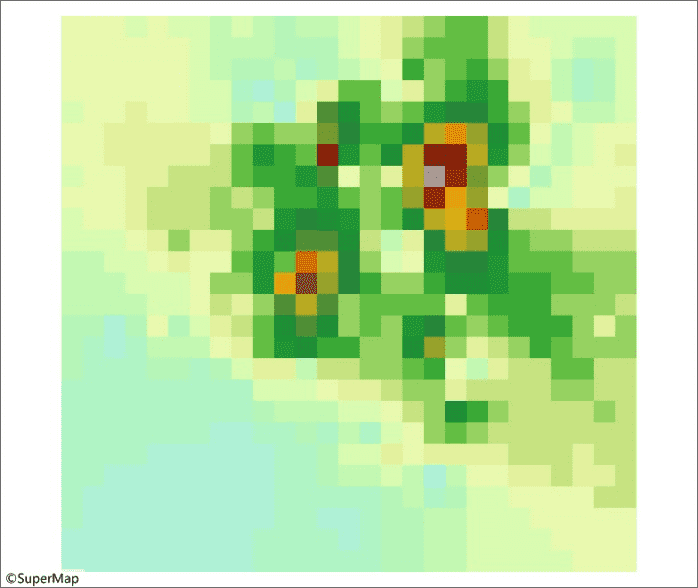
Using function Interpolation in Spatial Analysis > Raster Analysis to analyze the points of county. The result of interpolation analysis is obtained from all external rectangles that participate in the interpolation points, but the external rectangles of all county points can’t include the whole range for creating a map, so we need copy the range of Zhejiang province or appropriately increase the interpolation range. If the grid needs to be bigger, you can set a bigger resolution.
- Raster to vector
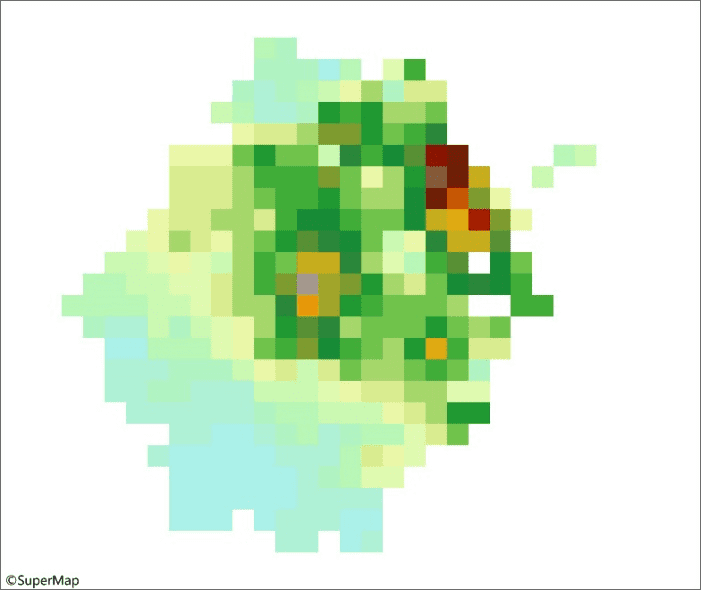
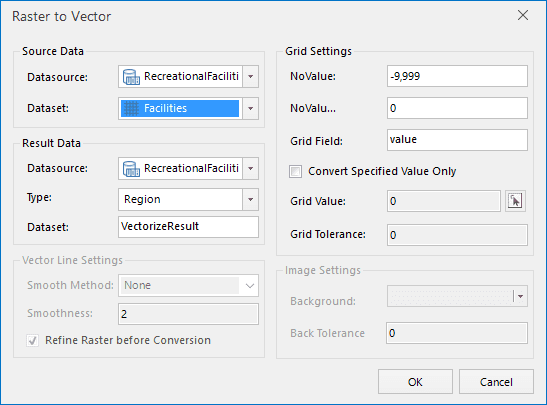
Clicking Saptial Analysis > Raster Analysis > Vector Converter > Raster to Vector to convert the clipped raster data to vector data.
Maps procedure
- Creating a simple digital map
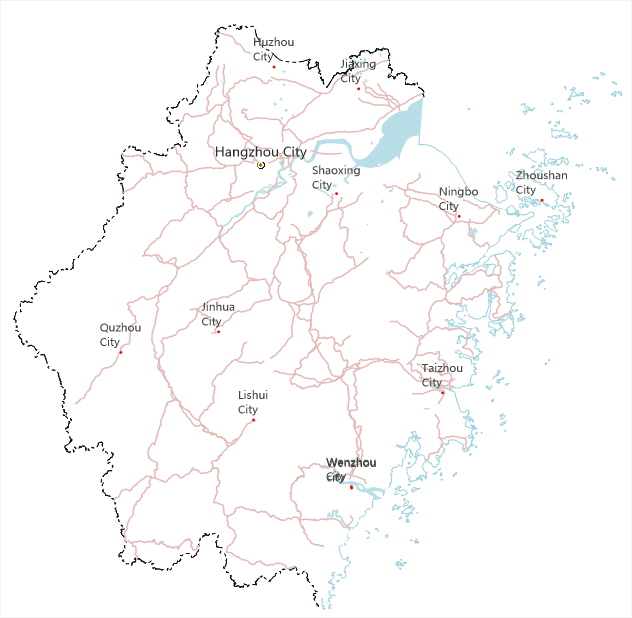
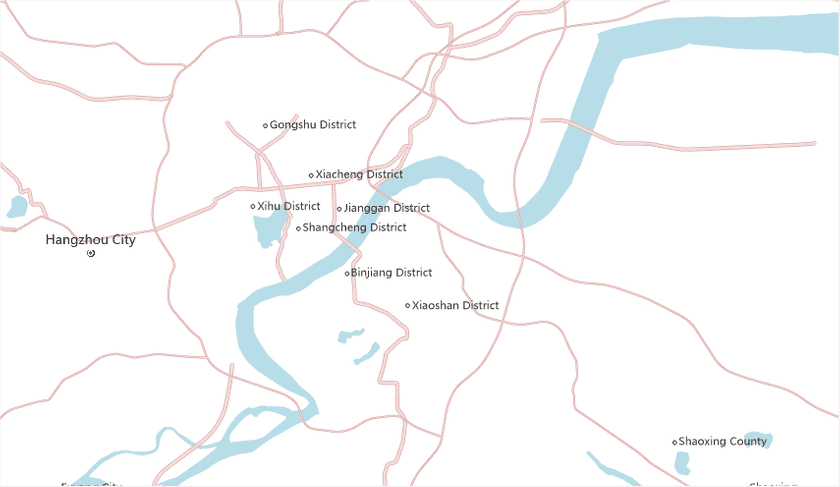
Adding administrative boundaries, main rivers and main roads, setting different symbols for different scale with different layers.
|
|
|---|
- Producing a ranges thematic map
Adding the region converted from raster, creating a range thematic map with value as an expression to be divided into 12 segments. Selecting an appropriate color scheme for range thematic map and setting a certain degree of transparency for it. Showing the venues number in the areas included by every grid in label thematic map for taking into account the integrity of the data.
- Adding auxiliary elements
Add descriptive text.
