Introduction
There are two ways for opening the chart. On the Start tab, in the Browse group, click Open Chart in New Map or Open Chart in Current Map in the Map button. This function is available only when the chart data exists in the workspace.
Basic Steps
Open in New Window
- In the Workspace Manager, select the dataset group you want to view. You can select several groups using Shift + click or Ctrl + click.
- On the Start tab, in the Browse group, click Open Chart in New Map. A new map window is created. Meanwhile, the entire chart is displayed in this map window.
Or you can perform as follows:
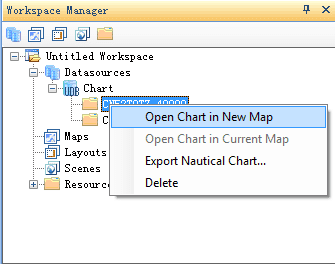
- Right click the node of the dataset group in the Workspace Manager. Select Open Chart in New Map in the context menu.
- Double click the node of the dataset group in the Workspace Manager. A chart will be displayed in the new window.
Open Chart in Current Map
- In the Workspace Manager, select the dataset group you want to view. You can select several groups using Shift + click or Ctrl + click.
- On the Start tab, in the Browse group, click Open Chart in Current Map. The entire chart is displayed in the current window.
Or you can perform as follows:
-
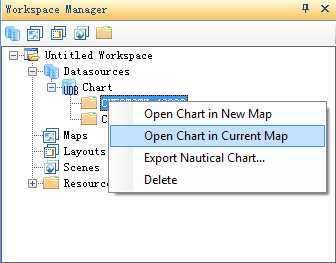
Right click the node of the dataset group in the Workspace Manager. Select Open Chart in Current Map in the context menu.
The function of Open Chart in Current Map realizes to display multiple charts in one map window. For appending charts, see Integration of Land and Sea.

