Geoprocessing modeler is a graphic representation of a series of operations for processing geographic data. Connect a series of process tools by a certain logical relationship and then perform them by one click. In a model, the output of a tool will be the input of the next tool.
With the geoprocessing modeler, you can process and analyze your data intelligently and effectively.
Highlight features
- Data-processing procedure construction: you can construct a data-processing procedure by adding, moving, and connecting tools.
- Construct models for complex relations among data: diverse tools for data processing are provided in the toolbox.
- Unattended operation: once you click the Run button, all tools will run automatically according to their order.
- Instant task tracing and parameters checking: The task manager shows the progress and status of each tool instantly and lists all operations that has finished.
- Conveniently loading or outputting model templates: iDesktop supports to import or export a model together with its parameters.
Instance
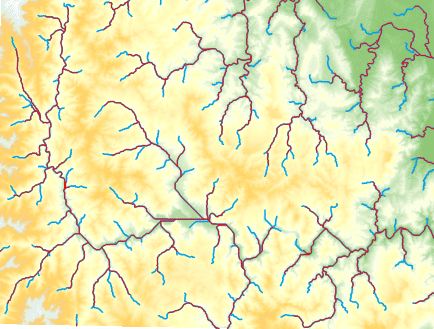
The model in the following figure is a hydrology analysis model. We want to know the distribution of rivers with the amounts of accumulation are 5000 and 10000 respectively.
The following tools will run one by one.
- Fill Sink: perform the analysis tool Fill Sink on DEM data.
- Flow Direction: calculate the flow direction based on the resulting data of Fill Sink.
- Flow Accumulation: calculate the amount of water collecting of each pixel according to the flow direction raster data.
- Extract Water System: extract all rivers that the amounts of water collecting is 5000 and 10000 respectively.
- Water System Vectorization: create vector water system data based on the resulting raster water system data.
Run all of the tools mentioned above. We get the following result: blue lines denote the rivers with accumulation is 5000, and the red lines represent the rivers with accumulation is 10000.

