Instructions
Thematic maps can show statistical information visually in real life. However, for more complicated data statistics, tables are a better choice. Hence, inserting a table in a map layout can make your published map more professional and map information more abundant.
Application scenarios
- In cadastral maps, tables are used for expressing cadastral investigation, boundary point coordinates, and so on.
- In a campus map, a table can include the specific name of each building, the departure time of each school bus, stations, and so on.
Function entrances
Open a layout window. Click Object Operations > Drawing > Table.
Operation instructions
- Draw a table in the layout window.
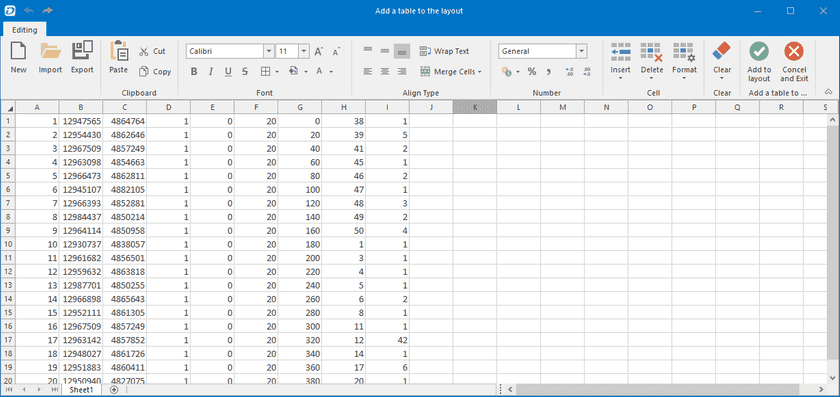
- A table editor appears where you can enter or input contents. The following ways are introduced to add contents into a table.
- Input : Enter the contents directly. You are allowed to set font styles and text alignment, merge items, insert columns/rows, and so on.
- Copy/paste : Supports copying and pasting other tables or text.
- Import : you can import a table (*.xlsx, *.xls, *.xlsm, *.xltx, *.csv ) or text contents into the table editor.
- Click the button Add to Layout. And then the table is inserted into the layout.
- Edit table : select a table and right click on it. In the context menu, select the button Edit Excel to open the table editor where you can change the table. To make your changes work, you must click the button Add to Layout.
- Adjust and resize table : select a table first. And then you can move the table or adjust its width and height.
- Export : Tables can be exported as Excel, TXT, or CSV files by following two ways.
- Select a table in a layout, right-click it and select Export to Excel. The resulting file could be an xlsx file or an xls file.
- In the table editor, click the button Export to export the current table as a file in the format of xlsx, xls, xlsm, xltx, csv, and so on.
