Tutorial
Monitor GIS Servers
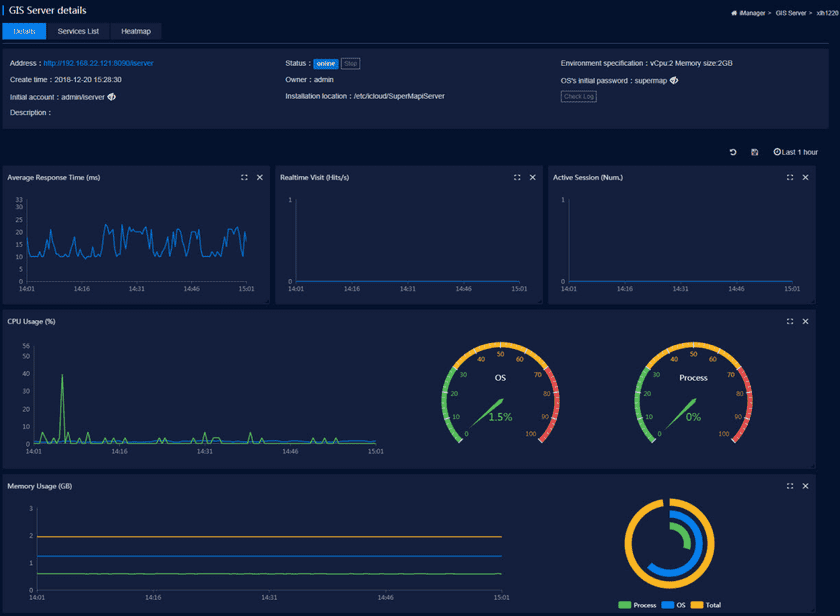
Clicks on the GIS server name or “Details” button to view detailed monitoring information of the GIS server, including service address, status, map access hotspot statistics, CPU useage, memory useage, active Session number, real-time access statistics, average response time.
There is a View Log button is on the Details page. For the normal use of the log view feature, make sure that there is an Index pattern with the index name being imanager_logs and Time-filed being @timestamp under index patterns on the management page on Kibana. If not exist, please refer to Appendix > Kibana Creates The Index Pattern to create it.
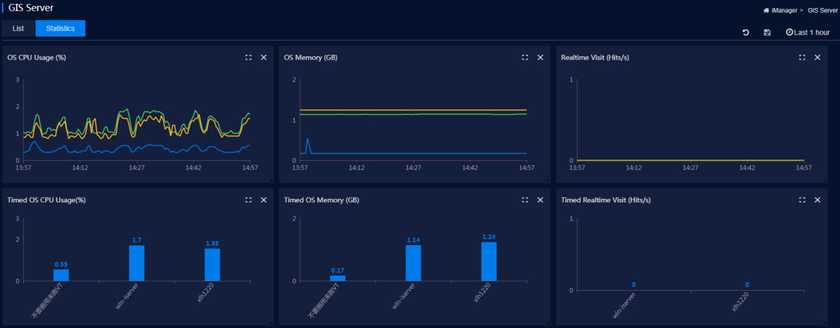
You can monitor the system CPU occupation (%) of all GIS servers, the current CPU occupation (%) of the system, system memory (GB), current memory of the system (GB), and real-time access statistics (times/sec) and current access statistics (times/sec) on the GIS Server Statistics page (iManager).

