Tutorial
Use GIS Servers
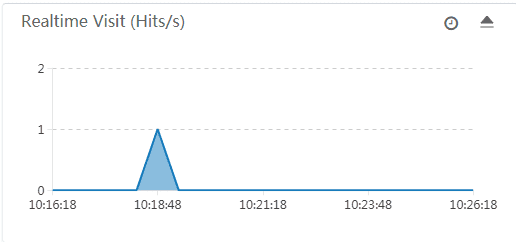
When the status of the GIS server is “online”, you can either click the corresponding “Service Address” link directly or enter the service access address in the browser to use the GIS server. When you use the iServer map service, the map access hotspot statistics will count the hotspots you visit. Historical data can be viewed.
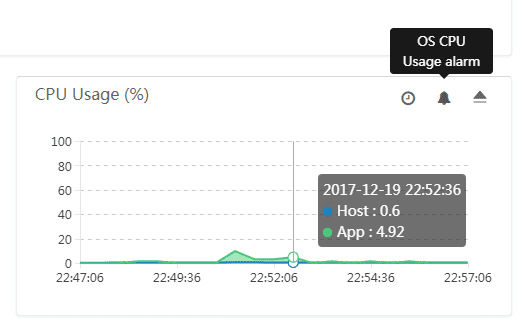
You can select time period on the statistics map to view the historical data that you want to view. iManager allows you to view data in the past 10, 20, 30 minutes. 1 hour, and 5 hours.
System Memory Useage Rate:
Support View CPU Occupation:
Real-time Access Statistics:
Docker platform, the GIS server provides the upload data function to upload data to the iserver, and the information can ba viewed in the GIS server details.


