Tutorial
Use GIS Portal
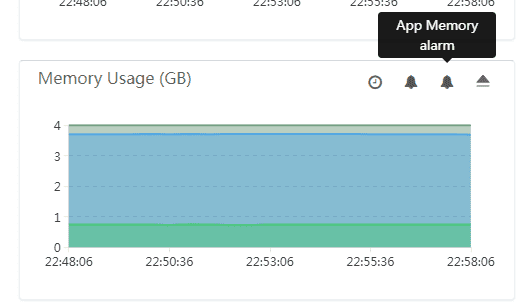
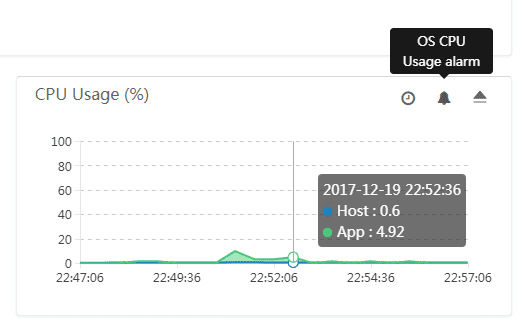
When the status of the GIS portal is “online”, you can either click the corresponding “Service Address” link directly or enter the service access address in the browser to use the GIS portal. When you use GIS portal resources and services, the 5 statistics maps will monitor the CPU useage, memory useage, average response time, real-time access statistics, and active Session number of the system and process for this period of time.
You can select time period on the statistics map to view the historical data that you want to view. iManager allows you to view data in the past 10, 20, 30 minutes. 1 hour, and 5 hours.
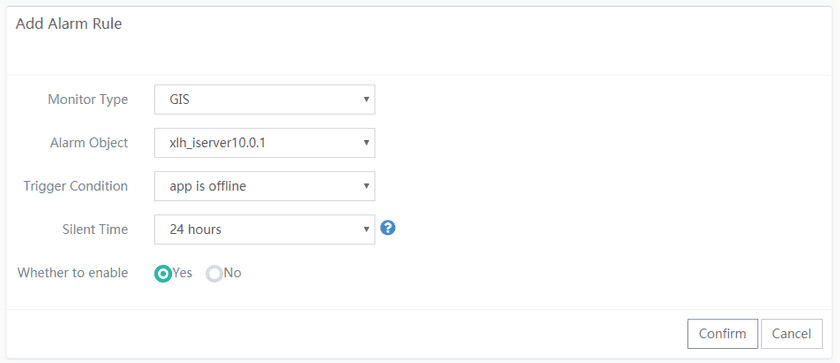
CPU useage, memory useage, average response time statistics also support the addition of alarm. For example, if you want to add system CPU alarm, click “System CPU Alarm” in the upper right corner of CPU useage statistics, you can enter the Add Alarm Rules page to add rules.


