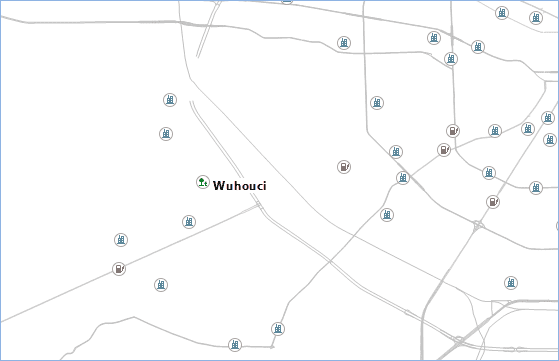
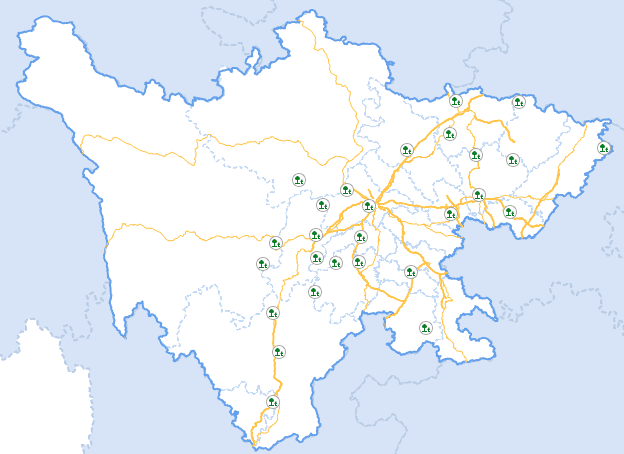
The most intuitive expressions in a map are symbols. Simple points, lines, and regions can be symbolized to increase the readability of map. SuperMap symbol libraries offer a rich set of 2D and 3D symbols. You can select styles, set the symbol sizes, colors, and transparency etc. You can also customize new symbols and styles, and also import icon images in png, jpg, bmp and other formats to SuperMap symbol libraries.
uses symbol editor and selector to manage all its symbols. The symbol selector is used to manage symbol resources, including its storage structure, adding/deleting symbols, importing/exporting symbols; the editor supports creating and modifying symbols; the selector is used to set the style of symbols, including their sizes, types, and colors.
Below illustrates how to set symbols for point, line, and region layers, and optimize the display effect:
Basic Steps
- In the Workspace Manager, double click Resources > Marker Symbol Library to open the Marker Library Selector. In the popup dialog box, click the File button and select Import-> Import Raster Symbol.
- In the Import Raster Symbol dialog box, select the image to import. In this example, create a new group and save all the imported raster symbols.
- Double-click the tourist places layer in the Layer Manager to open the Marker Symbol Selector dialog box. Select the tourist symbol you just created. To avoid distorting the raster symbol when displaying on a map, you need to set both the display size and marker size to 0mm to keep the original size.
- Click OK or Apply to complete. Set symbols for other points like hotels in the same way.
- In the Layer Manager, double click the line layers and set their line styles and color. You can also modify the line symbol, line width, and line color.
- In the same way, double click any region layer in the Layer Manager, and set the fill pattern. You can set the forecolor of the fill pattern, e.g. as white. Select a linestyle from the right side, e.g. System 0 in the root directory. Set the line width, e.g. 0.1mm, and set the line color, e.g. RGB (193, 216, 244).
- Set the region layer, e.g. the provincial administrations, with a fill pattern style, and set both the fore and background color, e.g. as white. Set the transparency, e.g. 100%, set the line width; e.g. 0.5mm; set the line color, e.g. RGB (98, 159, 234)
- Set the fill pattern style for the Province_P dataset layer. Set the forecolor to (RGB: 215, 228, 247). Select the line style symbol having a symbol name 8 and set the line width to 0.5mm and line color to (RGB: 184, 204, 228).
- Through the above settings, the display effect is enhanced and here shows some of the layers:

