


 Instructions for use
Hydrological Analysis is based on the Elevation Model (DEM) to establish the water system model, which is used to study the hydrological characteristics of the basin, simulate the surface hydrological process, and estimate the future surface hydrological conditions. Hydrological Analysis can help us analyze the scope of the flood, locate the source of surface runoff pollution, and predict the impact of landform changes on runoff. It is widely used in regional planning, agriculture and forestry, disaster prediction, Road Design and other industries and fields.
The Hydrological Analysis of SuperMap mainly includes Fill Sinks , Calculate Flow Direction , Calculate Flow Length、Calculate Flow Accumulation、 Stream Order、 Operations such as Connect River System and River System Vector ization .
Operation steps
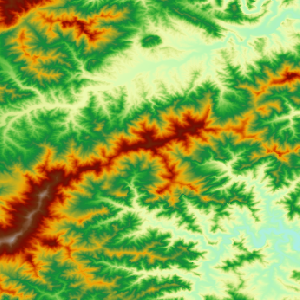
- In the Hydrology Analysis Datasource of Open File Location ExerciseData/Hydrology Analysis, there is Terrain Data of a region, and we use this data as the basis. Use the Hydrological Analysis automation process as an example.
- Click the Spatial Analysis tab-> Raster Analysis group-> Hydrological Analysis Drop-down Button and select Hydrology Analysis Process. The Hydrological Analysis Geo-Processing Automation (GPA) window appears as follows:
- Click the Fill Sinks icon to pop up the Parameter Settings panel on the right side of the window, and set Fill Sinks data in the panel, and if there is an area that has been determined to be a depression, check The Sink Data to be Excluded. Then select the swale Dataset, the Selected Region will not be filled during the Fill Sinks.
- Click the Calculate Flow Direction icon and set Calculate Flow Direction data parameters on the Parameter Settings panel. Select whether to check Force the flow direction outwards if it is at edge and Create the changing elevation gradient as needed. Please refer to the section of Calculate Flow Direction for specific meanings.
- At this point, the entire Geo-Processing Automation (GPA) model changes color according to the input and output of the data. If the Parameter Settings of the system's Geo-Processing Automation (GPA) model is defaulted, you can right-click in the blank area of the window and select Execute to complete the Hydrological Analysis operation.
- In the Hydrology Analysis Process, when the Application performs a certain calculation, it will automatically recommend the corresponding Dataset generated before, and there is no need to select it by itself.
- If the user needs to customize the Parameter Settings of the remaining operations, You can set the Parameters in the Parameter Settings panel after clicking the steps of Calculate the amount of water, Extract Raster River System, and River System Vectorization in the model. For detailed Parameter Description, please refer to the related links at the end of this article.
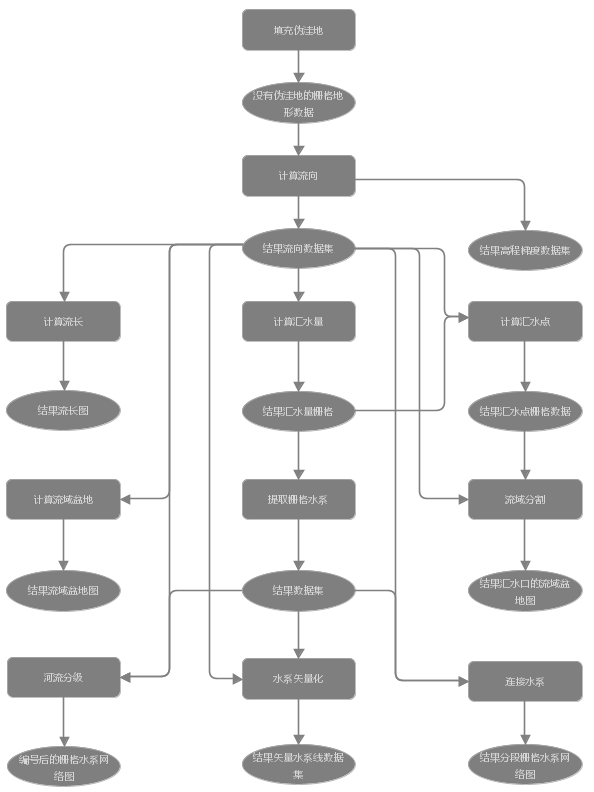 |
| Figure: Hydrology Analysis Process Management |
Note:
 |
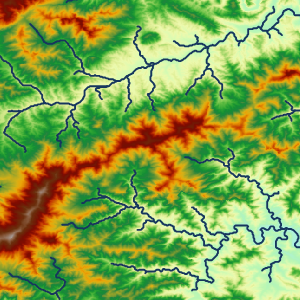 |
| Figure: River System Vector ization result | |
 Related content
 Calculate Cumulative Flow Accumulation.