Instructions
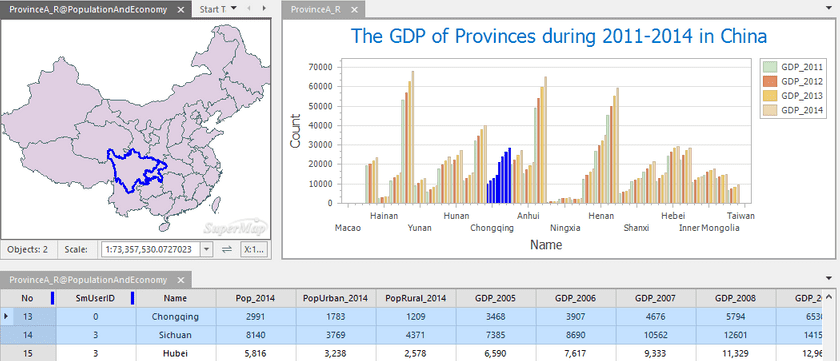
can associate a diagram with a map and an attribute table, which can help users to get more effective information such as the geographic distribution characteristics of data.
Basic Steps
- Open your diagram, map, and attribute table.
- Click View tab > Associated Browsing, then checking the windows you want. For more details about the associated browse feature, please refer to Associated Browse.

- The selection between an attribute table, a map, and a diagram is dynamic. If you select one or more objects in your diagram, the same objects in your map and attribute table will be selected. Similarly, a selection in your map or attribute table will also be reflected in your diagram. All selected objects will be highlighted.
- Selected Object Statistic : You can select one or objects that interest you as a filter to create a new diagram. The operation is detailed as follows:
- In the map window, select one or more objects, and then right-click mouse and select “Selected Object Statistics”.
- Select the diagram type you want to create.
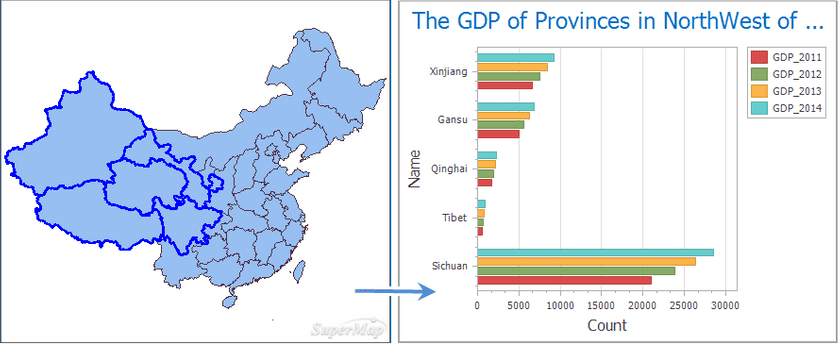
- If you want to view the GDP situation of 5 provinces in northwest of China, you can select the five provinces and then create a new graph, as follows:
