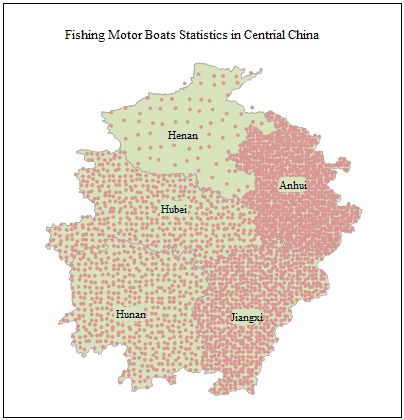
The dot density thematic map is another type of thematic map used to represent quantities, similar to ranges thematic maps and graduated thematic maps. But instead of using colors, patterns, or symbol sizes to symbolize, dot density thematic maps use density of dots to represent the value of an attribute associated with a region. Each dot represents a number of units, and the product got by multiplying the number of dots in a region and the units each dot represents is the value of the attribute of that region.
Click the Dot Density Map in the Thematic Mapping group to create the Dot Density Map. Click to select a dot density map template for users. Besides, you can customize the maps through the group dialog box for the Dot Density group, also called the Dot Density Map Manager. The following figure shows the power of the motor boats with dot density map.
You can create label maps for a point, line, or region layer. Set a layer as the current layer before creating a thematic map for it. To do so, select the layer in the Layer Manager.
