Overview
Network analysis facilitates the commerce and public services, as well as our daily life. The analysis results can provide an effective implementation proposal to help the user to make a more rational decision. Network analysis can help to solve the following practical problems:
- What is the shortest route from point A to point B?
- In the tourist attractions, how to choose a route which can past the most points of the interests at a time?
- How big is the coverage area of the customers of a newly opened supermarket? And how to determine its purchase volume?
- How to dispatch the recent fire engines for the rescue in the event of a fire?
- How can a distributor deliver all his delivery tasks in the shortest time?
In the world of geographic information, public infrastructure (power facilities, telecommunications and cable TV networks, road transportation, water network, etc.) are abstracted as network system composed by many interconnected lines. And the network model is the abstraction of the network system of the real world. Take the urban transportation network for example, the road and other linear features are abstracted as line segments, which are also called the network arcs. While the crossroads, the bus stops and the other point-like features are abstracted as points, in the network which are also called the network nodes. In the network model, resource information can transfer from a node to another node along the arc. We can consider the network is composed of the edges/lines, the intersected points/nodes and the other elements; it represents a possible path from one location to another one.
Basic Concepts
The network is a model which is composed of a group of interrelated arcs, nodes and their attributes. The network can express the real world’s roads, pipelines, etc.
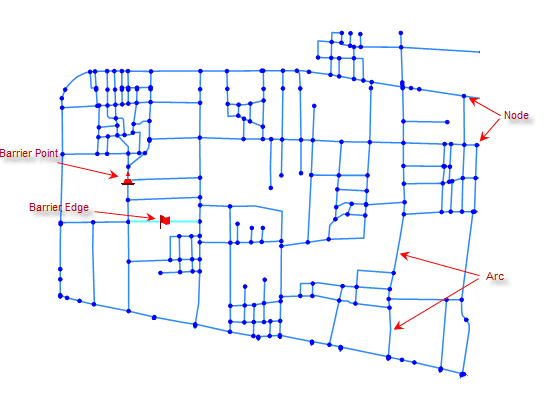
As shown in the figure above, the network not only has the abstracted topological relationship between arcs and nodes, also has geometric location feature and geographic attribute feature of GIS spatial data (topological relationship is the cross-correlation between geographic objects in spatial location, such as the connection relationship of nodes and lines, and lines and polygons).
The following describes the basic concepts involved in the network model:
- Nodes
Nodes are the places that arcs connects network, as shown above. Nodes can represent the real road intersections, rivers intersections, etc. The nodes and arcs respectively correspond to an attribute table, their adjacent relationships associate by the fields of attribute tables.
- Arcs
The arc segment is an edge in the network connecting with the other arcs by nodes. The arcs can represent the real-world highways and railways of the transportation network, the transmission line in the power network, the rivers of hydrological network, etc. The interconnected relationships between arcs have topological structure.
- Network Resistance
In our life, from the starting point, after a series of roads and junctions, we arrive the destination, which is bound to produce a cost measuring by distance, time and currency. In the network model, the cost of nodes and arcs is abstracted as the network resistance, and the information is stored in the attribute fields called the resistance field.
- Center Point
The center points are the discrete devices located at the nodes of the network and have the capabilities to accept or provide resources. Facilities are the substances, resources, information, management, cultural environment required by GIS, etc. For example, the school has educational resources and the students have to go to school to learn; the retail warehousing point stored the goods required by the retail outlets, and needs to deliver the goods to the various outlets. The center point essentially is a node in the network.
- Obstacle Edges and Obstacle Points
The problem of traffic jams in the city can be seen everywhere, which is a random and dynamic process, and it is no rules to follow. In order to reflect the real-time situation of transportation network, the traffic-jam arcs need to have the feature of temporarily inhibiting the passages of vehicles. When the traffic is back to normal, the attribute of the arc also can be set to normal in a real time. The concepts of obstacle edges and obstacle points can solve the above problems very well. The benefit to introduce the concepts of obstacle edges and obstacle points is that the obstacle settings are relatively independent, i.e., whether to set the obstacles has nothing to do with the current network environmental parameters.
- Turn Table
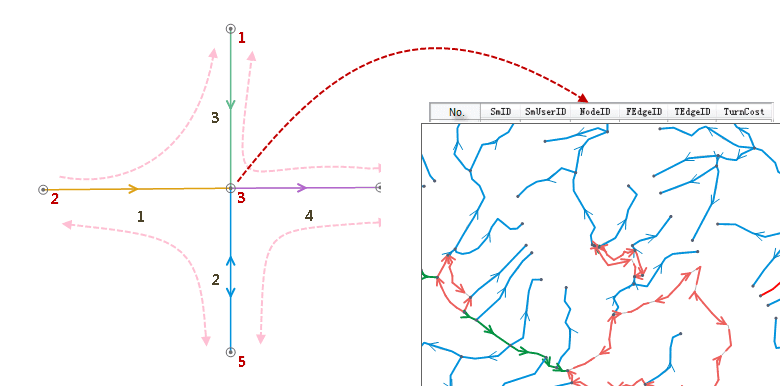
Turning is the process that a arc passes through the middle node to arrive the adjacent arc. Turning cost is the cost to complete a turning. Turn table saves the cost of the turning. The turn table must list all the possible turns of every crossroad, generally including the start arc field (FromEdgeID), the end arc field (ToEdgeID), the node identification field (NodeID) and the turn cost field (TurnCost). These fields correlate with the fields in arcs and nodes. Each record in the table dictates a arc cost passing the road node. Turn cost is usually directional, the negative cost values of the turning generally means to prohibit the turning.
For example, for the network analysis of the roads, we often encounter the crossroads, divergence, etc. The figure on the right is a crossroad diagram, and the table on the left is a turn table corresponding to the crossroad. In the turn table, there are the cost records that the vehicles turn at the crossroads.

