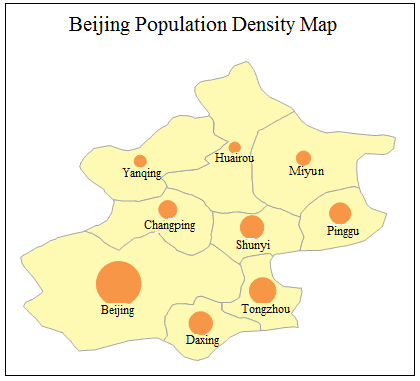
The graduated symbols map uses symbols with different shapes, colors and sizes to represent the quantity and quality characteristics of each object which is independent and displayed in an overall concept. Normally, the shape, color and size of the symbols reflect the specific attributes of the object; the shape and color represent the quality characteristic, while the size of the symbol means the quantity feature. The graduated symbols map is mainly used to the map with the quantity features, such as the classification of the food production in different regions, GDP, population, etc. It means that the thematic variable type which is used to make the graduated symbol map is numeric.
Click the Graduated Symbols button in the Thematic Maps group to create the system default graduated symbols. Users can set the parameters. Besides, you can customize the maps through the group dialog box for the Graduated Symbols group. The following figure shows the population density in Beijing with a graduated symbols map.
You can create graduated symbols maps for a point, line, or region layer. Set a layer as the current layer before creating a thematic map for it. To do so, select the layer in the Layer Manager.
