Ranges thematic maps display data of a specific attribute according to ranges you set. These ranges are shaded with different colors, patterns, line styles, or symbols. In a range map, the thematic values are divided into several ranges according to a certain ranging method. A range is assigned to each feature based on the corresponding thematic value. The same styles, such as color, fill, and symbol, are applied to features of the same range. A ranges map must be based on a thematic variable of a numerical type. Ranges maps are usually used to represent volume or degree characteristics of continuously distributed phenomena, such as distribution of precipitation and distribution of soil erosion rate. DEM and GRID layers are also supported.
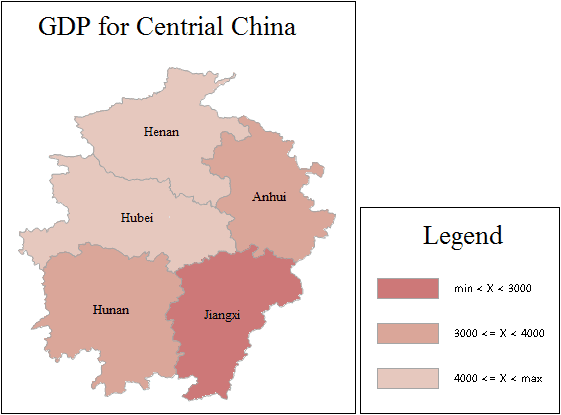
Click the Range Map button in the Thematic Map tab to generate the default thematic map. The user can modify the parameter settings on this basis to create a range map that meets the needs of the drawing. The figure below is a range map of per capita GDP in all provinces in China in 2000.
From the figure, we can clearly see the per capita GDP for each province.
You can create ranges maps for a point, line, or region layer. Set a layer as the current layer before creating a thematic map for it. To do so, you can select the layer in the Layer Manager. Meanwhile, the map can be edited after finished. For more information, see Editing Thematic Maps.
