Big data visualization is everywhere nowadays. Requirements for data visualization are growing over time and data visualization has became a new way of reading and understanding information. In GIS field, big data can be mined by the way of big data visualization to present user data spatial distribution pattern, trend, relevance and statistics information.
Big data visualization can be done in real time, and the result can be updated with the changes of scales. iDesktop allow you to achieve data visualization by one click.
Summary Sheets:
One of ways of big data visualization. You can through a heat map to present temperature, density and access frequency, etc. By big data visualization, valuable information can be extracted from big data and then be displayed intuitively.
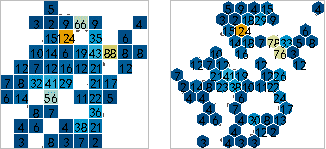
Grid aggregation maps can present distribution and statistics characteristics of spatial data. Two shapes are provided for the display of a grid aggregation map, one is rectangle, and another is hexagon.

