


Central Feature
Feature Description
The Central Feature tool identifies the most centrally located feature in point, line, or polygon datasets.
Analysis Principle
This method calculates the cumulative distance from each feature's centroid to all other features' centroids. The feature with the smallest cumulative distance is determined as the central feature. When a weight field is specified, the calculation uses weighted cumulative distances to determine the central feature.
Application Scenarios
- When planning a new sports complex in an urban area, identify the central feature among city blocks using population-weighted calculations to find the optimal location with minimal transportation costs.
- For a supermarket chain distributing goods from multiple warehouses, locating the central warehouse minimizes total transportation distance when using shortest path routing.
Feature Entry
- Spatial Statistics Tab -> Measuring Geographic Distributions -> Central Feature.
- Toolbox -> Spatial Statistics -> Measuring Geographic Distributions -> Central Feature.
Parameter Description
- Source Dataset: Specifies the vector dataset for analysis (point/line/polygon). For lines/polygons, centroids are used in calculations. Weight defaults: 1 for points, line length for lines, area for polygons.
- Group Field: Field for grouping analysis features (integer/date/string type). Each group will have its own central feature. Features with empty values in this field are excluded.
- Weight Field: Applies weights to distance calculations using formula D = W1 × d, where W1 is the weight value and d is the inter-feature distance.
- Self Weight Field: Specifies self-transportation cost using formula D = W1 × d + W2, where W2 is the self weight value.
- Measure Distance Method: Supports Euclidean distance and Manhattan distance. For detailed definitions, see Spatial Statistics Basic Terms.
- Mean Center: Configures reserved fields and statistical types for result data in the field list.
- Result Settings: Defines the output datasource and dataset name for storing results.
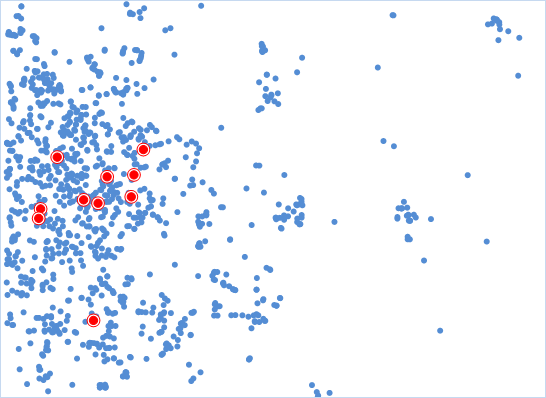
The blue points in the following diagram represent supermarket locations. Red points indicate central warehouses calculated for each supermarket category, achieving minimal cumulative transportation distance.
Related Topics