


Feature Description
The linear directional mean can be used to analyze the main direction of line objects. Generally, linear elements point in one direction, where the position from the starting point to the destination can represent practical information such as vehicle trajectories (each turn represents a trip segment) or hurricane paths. However, some lines like contour lines have no directionality. There are also lines with orientation values but no directional values, such as fault lines indicating extension direction and scale - typically described as "having northwest-southeast orientation" without specific directionality.
Application Scenarios
- Compare two or more sets of lines. For example, wildlife biologists could calculate migration paths of elk and moose in valleys to determine their directional trends.
- Compare features across time periods. Ornithologists might compute monthly trends of falcon migration. While GPS tracking generates extensive animal movement data, directional means can summarize multiple flight paths and smooth daily movements, revealing which month shows fastest migration speed and when migration concludes.
- Compare dynamic and static data, such as assessing logging patterns in forests to understand wind patterns and directions.
- Analyze glacial striations indicating ice movement patterns in glaciology studies.
- Identify general directions of vehicle theft and recovery in crime research.
Feature Entry
- Spatial Statistics Tab -> Measuring Geographic Distributions -> Linear Directional Mean.
- Toolbox -> Spatial Statistics -> Measuring Geographic Distributions -> Linear Directional Mean.
Parameter Description
-
Source Dataset: Specify the vector line dataset for analysis.
-
Group Field: Field for categorizing features. Each group will generate an ellipse. Accepts integer, date, or string types. Features with empty values will be excluded.
-
Weight Field: Numeric field representing weights. For example, using traffic accident severity levels as weights allows result ellipses to reflect both spatial distribution and severity.
- Ignore direction order for start and end points:
- Unchecked (default): Considers start-to-end point sequence when calculating directional mean, maintaining line directionality.
- Checked: Ignores start/end sequence, treating lines as non-directional (start-to-end equals end-to-start).
-
Mean Center: Configure reserved fields and statistics types for result data in the field list.
-
Result Settings: Set the datasource and dataset name for storing results.
Result Interpretation
The output creates a new line feature centered at the mean center of all input data centroids. The line length equals the average length of input features, with orientation representing their average direction.
Attribute values include:
- AverageX and AverageY - Mean center coordinates
- AverageLength - Average line length
- CompassAngle - Compass angle (clockwise from true north)
- DirectionalMean - Directional mean (counterclockwise from true east)
- CircleVariance - Circular variance (measuring directional deviation from mean)
The tool introduces "circular variance" (0-1 range), analogous to standard deviation, indicating directional variation. Values near 0 show uniform directions; values approaching 1 indicate widespread directional dispersion. Higher values denote greater directional diversity.
Example
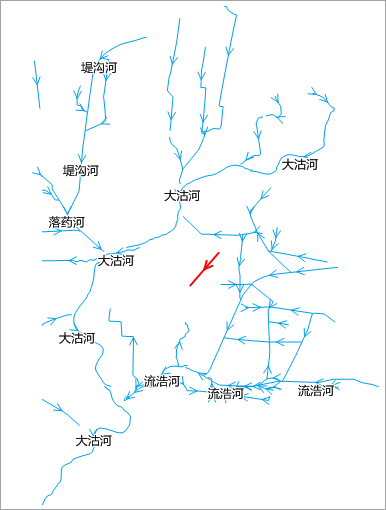
The figure shows rivers near Pingdu City and Jimo City in Shandong Province. The red line represents calculated linear directional mean, centered at the mean center of all river centroids. Its length equals average river length, with orientation showing average direction.
Related Topics