


Feature Description
Mean center identifies the geographic center (or the center of concentration) for a set of features. The result is a new point object rather than existing features in the source data.
Analysis Principle
The resampling methods of mean center are straightforward: Calculate the x and y coordinates of the center point by averaging the x and y coordinates of all points. The formula is as follows:
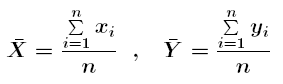
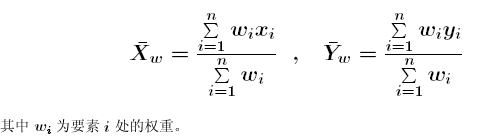
If a weight field is specified for the mean center, the weight values will be considered in determining the center location. The calculation formula is:
Application Scenarios
- Comparing mean centers of theft incident points during daytime and nighttime helps evaluate shifts in crime hotspots, enabling public security departments to allocate resources more effectively.
- Wildlife biologists can calculate the mean center of elk distribution in a park to understand where herds congregate in summer and winter, providing better information for park visitors.
Feature Entry
- Spatial Statistics Tab -> Measuring Geographic Distributions -> Mean Center.
- Toolbox->Spatial Statistics->Measuring Geographic Distributions->Mean Center.
Parameter Description
- Source Dataset: Specifies the vector dataset for analysis, supporting point, line, and polygon datasets. For lines/polygons, their centroids will be used. Point weight=1, line weight=length, polygon weight=area.
- Group Field: A field to categorize features. Each group will have a central feature. Supports integer, date, or string types. Features with null values in this field will be excluded.
- Weight Field: Applies weights when calculating distances between features. Weighted distance formula: D = W1 × d, where W1 is the weight value and d is the original distance.
- Mean Center: Configures reserved fields and statistics types for result data in the field list.
- Result Settings: Specifies the output datasource and dataset name for result storage.
After configuring parameters, click "OK" to execute the mean center analysis.
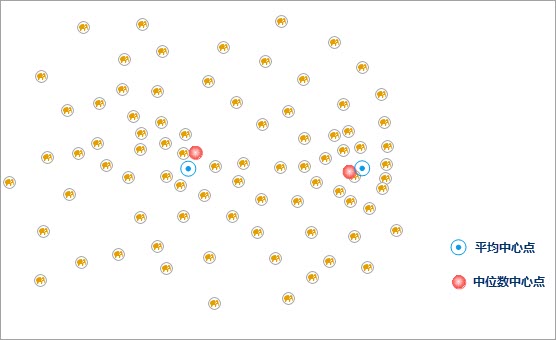
As shown below: The yellow points represent elephant activity locations in a wildlife park. Calculating the mean center helps determine congregation areas, providing better position information for visitors.
Related Topics