


Feature Description
Directional distribution is used to summarize the spatial characteristics of geographic features: central tendency, dispersion, and directional trends. This method calculates the standard deviations of x and y coordinates starting from the mean center, thereby defining the axes of an ellipse, which is consequently termed the standard deviation ellipse.
Application Scenarios
- Mapping the distribution trend of criminal activities can reveal correlations with specific elements (e.g., bars, restaurants, or particular streets).
- Visualizing groundwater well samples with specific contaminants can indicate toxin dispersion patterns, aiding in deploying mitigation strategies.
- Comparing the size, shape, and overlap of ellipses across ethnic regions provides insights into racial or ethnic segregation.
- Plotting disease outbreak ellipses over time helps model epidemic spread.
Feature Entry
- Spatial Statistics Tab -> Measuring Geographic Distributions -> Directional Distribution.
- Toolbox -> Spatial Statistics -> Measuring Geographic Distributions -> Directional Distribution.
Parameter Description
- Source Dataset: Specifies the vector dataset for analysis, supporting point, line, and polygon datasets.
- Ellipse Size: Sets the confidence level of the result ellipse. Three standard deviation levels are available, with different coverage ranges:
- One standard deviation: Covers approximately 68% of source data centroids.
- Two standard deviations: Covers approximately 95% of source data centroids.
- Three standard deviations: Covers approximately 98% of source data centroids.
- Group Field: Categorizes features into groups, with each group generating an ellipse. Accepts integer, date, or string types. Features with empty values will be excluded.
- Weight Field: Assigns a numeric field to weight features (e.g., accident severity levels), reflecting both spatial distribution and weighted attributes in results.
- Mean Center: Configures reserved fields and statistical types for result data in the field list.
- Result Settings: Specifies the destination datasource and dataset name for output.
Result Description
The output is a region dataset where each ellipse contains the following attribute fields. The map renders the flat field from results and group field from source data.
| Field | Description |
|---|---|
| CircleCenterX | X-coordinate of circle center |
| CircleCenterY | Y-coordinate of circle center |
| SemiMajorAxis | Major semi-axis |
| SemiMinorAxis | Minor semi-axis |
| RotationAngle | Ellipse orientation (angle between major axis and true north) |
| district_Group | Group field |
| flat | Ellipse flatness |
- The major semi-axis indicates the direction of greater dispersion, while the minor semi-axis reflects higher clustering.
- A larger difference between axes (higher flatness) implies stronger directional trends. Similar axis lengths suggest weak directionality.
- Equal axes produce a circle, indicating no directional characteristics.
Example
Sample Data: Click to download sample data (requires extraction after download).
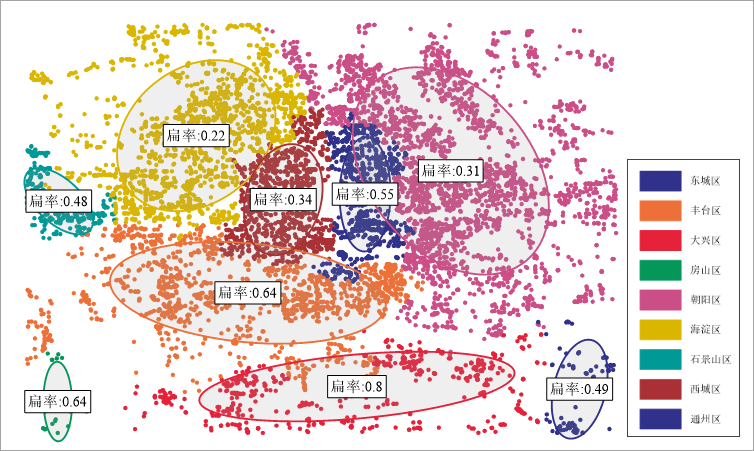
The directional distribution analysis of medical facilities in districts is shown below. Daxing District exhibits the highest ellipse flatness (0.8), indicating the most pronounced directional distribution.
Related Topics