


Feature Description
Measures the dispersion or concentration of a set of features around their mean center. The result data is a circle centered at the mean center of all sample data, with its radius equal to the standard distance of all data. This circle reflects the clustering degree of all data around the mean center - a smaller radius indicates higher concentration.
Application Scenarios
- Compare distributions of multiple sampled values. For example: In crime analysis, crime analysts can compare the compactness between assault incidents and theft incidents. Understanding different crime patterns helps police formulate response strategies. If crimes in a specific area are tightly clustered, deploying one police car near the area center may suffice. If widely dispersed, multiple patrol cars may be required for effective response.
- Compare distribution patterns of the same feature type across different time periods. For example: Analysts can compare daytime thefts versus nighttime thefts to determine whether thefts are more dispersed or concentrated during specific periods.
- Compare feature distributions against static elements. For example: Measure and compare emergency call distributions received by fire stations within a region over several months to identify stations covering wider service areas.
Feature Entry
- Spatial Statistics Tab -> Measuring Geographic Distributions -> Standard Distance.
- Toolbox->Spatial Statistics->Measuring Geographic Distributions->Standard Distance.
Parameter Description
- Source Dataset: Specifies the vector dataset to analyze, supporting point, line, and polygon datasets.
- Ellipse Size: Sets the confidence level of the result circle through three standard deviation levels with varying coverage ranges:
- One standard deviation: Covers approximately 68% of source data centroids;
- Two standard deviations: Covers approximately 95% of source data centroids;
- Three standard deviations: Covers approximately 98% of source data centroids;
- Group Field: Categorizes features into groups (integer, date, or string type). Each group generates a separate circle. Features with empty values in this field will be excluded.
- Weight Field: Specifies a numeric field to weight features. Example: Using casualty counts in terrorism incidents to reflect spatial distribution severity.
- Mean Center: Configures reserved fields and statistical types for result data in the field list.
- Result Settings: Specifies the output datasource and dataset name.
Result Interpretation
The output is a region dataset containing circles with standard distance radii, where each circular area indicates the dispersion/concentration degree around the mean center. Each circle contains the following attribute fields, with map rendering based on group field:
| Field | Description |
|---|---|
| CircleCenterX | X-coordinate of circle center |
| CircleCenterY | Y-coordinate of circle center |
| StandardDistance | Standard distance |
| district_Group | Group field |
A larger standard distance radius indicates higher data dispersion, while a smaller radius suggests greater data concentration.
Example
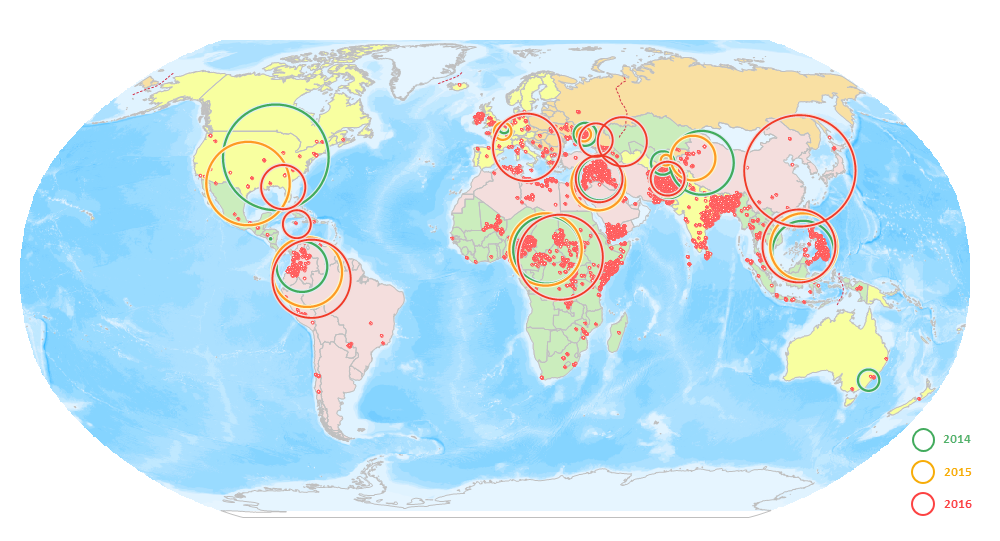
The figure below compares the dispersion degrees and mean center changes of terrorism incidents across regions in 2014, 2015, and 2016. Green, orange, and red represent results from 2014, 2015, and 2016 respectively. Taking South America as an example: The 2015 results show greater dispersion than 2014, while 2016 shows even higher dispersion than 2015, indicating expanding impact areas of terrorism incidents.
Related Topics