


Image Composite
Feature Description
Image composite refers to combining three single-band image data into an RGB image. Users can select optimal bands for synthesis according to needs to improve display speed and accuracy. Color composition follows the additive color synthesis principle, assigning red, green, and blue primary colors to three specified bands of remote sensing imagery respectively to generate color images.
Different band combinations highlight distinct ground feature characteristics. Taking TM imagery's seven-band data as an example, common band combinations include:
- Band 321: True color composite. Assigning bands 3, 2, and 1 to red, green, and blue respectively produces natural color images matching actual scene colors. Suitable for shallow water detection mapping and non-remote sensing professionals.
- Band 432: Standard false color composite. Assigning bands 4, 3, and 2 to red, green, and blue respectively highlights vegetation in red. Widely used for vegetation extraction, crop analysis, land use studies, and wetland monitoring.
- Band 453: The most information-rich combination. Band 5 generally contains the richest information in TM data. Assigning bands 4, 5, and 3 to red, green, and blue produces images with strong color contrast and layered details. Commonly used for visual interpretation and delineating land-water boundaries.
- Band 741: This combination integrates mid-infrared, near-infrared, and visible band info. It provides abundant geological and environmental information with clear structural features (folds and faults) and distinct lithological boundaries, offering excellent interpretability for geological studies.
Feature Entry
- Data Tab->Data Processing->Raster->Image Composite.
- Toolbox->Data Processing->Raster->Image Composite.
Steps
- Red Band: Specify a dataset of a band, load it through the red channel, and render the raster data using red as the base color.
- Green Band: Specify a dataset of a band, load it through the green channel, and render the raster data using green as the base color.
- Blue Band: Specify a dataset of a band, load it through the blue channel, and render the raster data using blue as the base color.
- Result Settings: Select the target datasource and name for the result dataset, which defaults to the same datasource as the input single-band datasets.
After configuring these parameters, execute the image composite operation.
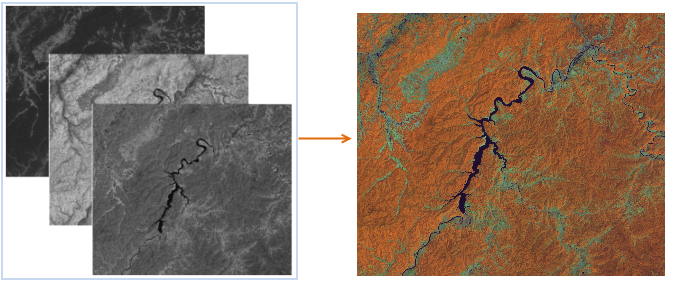 |
| Color Image Composite of Band 453 |
Related Topics