To generate vector tiles, you need to prepare an effective vector map, and
point, line, region, text layers in the map must be available for generating
vector tiles, and most of settings of like map feature symbolizing, layers are
supported by MapBox. Because of the differences between MapBox and SuperMap in
style expressions, the production of vector maps has some limitations and
considerations. This article introduces the contents on drawing maps you
should notice in details including: coordinate systems, data complexities,
style settings like map symbolizing, visible scales and so on.
Coordinate systems
During drawing a map. we can open Dynamic Projection to make data display correctly if the coordinate system of data is inconsistent with the coordinate system used by the map. So when you generate vector tiles from the kind of maps, suggest you convert coordinate systems of data to the corresponding coordinate systems used by maps. Vector tiles use the coordinate system adopted by the corresponding map, so, when it is not the same with the coordinate system used by your map, the program will convert the coordinate system of data to the map coordinate system which will be very time consuming and occupy more large space.
Reduce data complexities
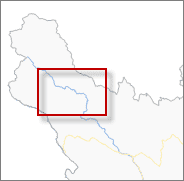
When generating tiles, to save time of generating tiles and improve the efficiency of displaying tiles, the objects with dense nodes are rarefied to reduce redundancy nodes. In general, the rarefying is not obvious visually except some special situation, like the display of a river, in a small scale, using region objects expresses the river, and these objects have dense nodes and complex shapes, and after rarefying them, they are distorted visibly. Therefore, we suggest that using lines expresses rivers in a small scale when producing a map for generating map tiles.
Besides, if a feature in a map contains too many sub objects, we suggest dividing sub objects to improve the efficiency of generating tiles.
Symbolizing map
The SuperMap symbols supported by MapBox contain: almost all point symbols, line symbols like commonly used road symbols and commonly used filling symbols. To make the vector tiles can be shown normally, please avoid using very complex symbols. For some symbols unsupported by MapBox, you can replace original symbols through the following schemes.
The following table details all replacing schemes
The following table details all replacing schemes for SuperMap region symbols
In summary, the symbols that are not supported by the MapBox are displayed as corresponding dots, solid lines, and solid colors according to the symbol type. The MapBox style supports the outline of filling symbol exactly as it does the line style symbol.
Note :
- The symbols in vector tiles can not be zoomed as the map is zoomed.
- For the customized line symbols, MapBox supports the line symbols with lots of child lines, but the type of each child line must be the “short-dash(system)“. Besides, MapBox does not support the offset setting and end-symbol setting of child symbol.

|

|
|---|---|
| Figure: Child line types supported by MapBox | Figure: Child line properties dialog box |
- For the customized filling symbols, MapBox supports the kind of filling symbols which contain only one filling child layer (image filling or symbol filling).
Text effects
MapBox style also has limitations on the text effects in SuperMap maps. Therefore, you need to pay attention to the style settings of all texts in the map, and avoid using the font effects that are not supported by the MapBox style. The details are as follows:
| Text effects | Map | Vector tile | Supports or not |
|---|---|---|---|
| Bold Outline |

|

|
v |
| Bold Italic |

|

|
v |
| Shadow |

|

|
x |
| Underline |

|

|
x |
| Strikethrough |

|

|
x |
Note :
- Text size in a map should be fixed if you want to generate vector tiles from the map in case of the text effects in tiles might be different from in the map.
- The style of the first text object in each text layer is used for all texts from the corresponding layer.
- When using bold and italic fonts, you need to ensure there is bold and italic font libraries in your computer, in that case, the bold and italic effect can be shown on vector tiles. For example: if the used font is bold and italic Microsoft YaHei, there must be the Microsoft YaHei Bold font library and the Microsoft YaHei Italic font library in your computer.
 |
|
Create thematic maps
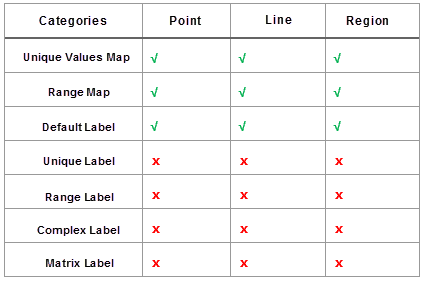
Thematic maps are created for making map contents more abundant, however, not all kinds of thematic maps are supported by MapBox, and the following table introduces the specific situation. The unsupported thematic maps will be ignored when generating vector tiles.
Note:
- Offset settings of point, line, region unique thematic maps are not supported by MapBox style.
- Only the original field can be used for showing names of features in a label thematic map, and the result of SQL expressions can not be shown.
- MapBox does not support setting the point symbol while setting the label background when a point layer and the label thematic map which is created based on the point layer exists in your map, otherwise, all point symbols will miss and all label backgrounds will deviate from corresponding text.
- MapBox only allows two kinds of directions along lines: from up to down, from left to right along the normal direction. If other directions are set in the original map, labels in tiles will be placed in the direction “top to bottom, left to right”.
Restrict range of visible scales
In general we set some visible scales for layers to improve map display performance, that also can improve the efficiency of drawing maps in tiles.
Differences between tiles and maps in display
Because of the expressing of Mapbox style is different from SuperMap, there are some differences in detail of map display. Following contents lists the main differences to help you know more about vector tiles. All figures of vector tiles below are rendered by MapBox GL.
- Typography : MapBox is different from SuperMap in line feeds of long labels.
- Labling along lines : The way that MapBox processes text along lines is different from SuperMap, hence, the display effects are different two.
| Map | Vector tiles |
|---|---|

Set the interval of text along line as 1.3 times |

The interval is small. |

|

The number and positions of the labels along lines in vector tiles are different from in the map. |
- No Overlap and Overlap : MapBox is different from SuperMap in processing of feature overlaps which leads to the differences in number of labels, alignment of labels to points and so on. Besides, the overlap settings in SuperMap are not worked in vector tiles.


