This paper summarizes the main factors that affect the map display performance and Display Effects in Application, and provides the corresponding optimization strategies. Of course, the display performance and aesthetic effect of the same map can not be achieved at the same time, and users can choose flexibly according to the specific situation.
1. Map Display Effects Optimization
2. Map Display Speed optimization
1. Map Display Effects Optimization
The ways to optimize the Display Effects of the map include: map anti-aliasing, layer order adjustment, text cascading optimization, etc.
Enable map anti-aliasing
Anti-aliasing: When drawing a line or polygon boundary that is not horizontal and not vertical on a raster graphics display, it can have a more or less jagged or stepped appearance. This is because straight lines, polygons, color boundaries, and the like are continuous, while a raster is composed of discrete points, and the representation of straight lines, polygons, and the like on a raster display device must be sampled at discrete positions. The information distortion caused by insufficient sampling and reconstruction is called "aliasing". The technique used to reduce or eliminate this effect is called anti-aliasing.
Map antialiasing: For Map Information distortion, antialiasing processing is performed on lines, polygons, texts, etc. in the map, including Line Antialiasing and Text Antialiasing. Anti-aliasing works only when map anti-aliasing and layer anti-aliasing are turned on at the same time when the layer transparency is 0. To turn on map anti-aliasing, check the "Antialiasing" check box in the Layer Properties panel.
For details about how to set the map anti-aliasing effect, see Enable Line Antialiasing and Enable Text Antialiasing.
Adjust the layer order
In a map, the order in which the layers are stacked directly affects the Display Effects of the map. Adjusting the layer order of the map is the most basic and simplest way to optimize the map Display Effects.
For the basics and procedures for adjusting the layer order, see Adjust the layer order .
Optimize text cascading
In the map display, multiple texts may be cascaded to affect the map Display Effects. There are two best solutions:
- By filtering the display, part of the cascading text is filtered out, and a complete Text is retained according to the priority or specific needs of the cascading text.
- To the extent appropriate, in the case of simultaneous display of text, the cascading situation is resolved by a No Overlap between the texts.
In order to solve the problem of text overlapping, Application provides the functions of covering text filtering display and No Overlap.
Text Filter Display
For the text layer, the capped Text can be set not to be displayed, and the input Text can be automatically filtered out, so as to avoid capping. See the Filter the glanded text in the map for details on how to filter the text of the gland.
Text No Over lap
For Thematic Label Map, you can set the text No Overlap to have the labels appear together in the appropriate range without affecting each other. For details, see the Properties tab in the Thematic Label Map.
Overlap Settings
In the actual mapping process, when there are many layers in the map, it is easy to appear the capping objects between different layers, such as the capping of point layers and Thematic Label Map layers, the capping of multiple label layers, etc. The Overlap Settings function and the Point with Label Avoidance Help enable the user to control the capping object and the avoidance of the point with its label. See Overlap Settings for details.
Crosshair optimization
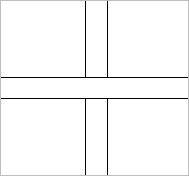
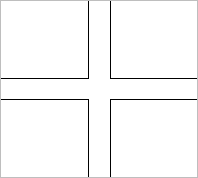
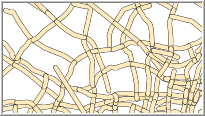
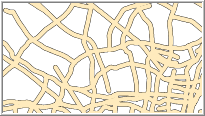
In maps, we often encounter crossing lines, such as water systems, roads and so on. If it is not processed, the display according to the normal situation is not only not beautiful enough, but also may not conform to the actual situation, and the connectivity between cross lines can not be correctly expressed.
In the Create Map process, in order to achieve realistic Display Effects, this kind of "intersection" crossing line needs to be optimized.
Optimize Cross |  |
| not used | Use Optimize Cross |
, SuperMap Desktop Application provides the function of "intersection display optimization" to meet the above requirements. As shown in the figure below, Optimize the ordinary two-lane road and three-way road, but do not use Optimize Cross for overpasses, expressways, etc. With the help of Layer Control function, you can easily realize the optimization effect of different layers. For more information on Optimize Cross, refer to the Enable Optimize Cross.
Optimize Cross |  |
| not used | Use Optimize Cross |
2. Map Display Speed optimization
In Application, the optimization of map Display Speed is mainly to improve the speed of Display and Browse by reducing the layers and objects displayed in the map. Map Display Speed optimization methods include: object filtering display, layer filtering display, Map Cache, etc.
Object filtering display
When themap is displayed, in order to improve the browsing speed, it is often necessary to filter some objects according to certain conditions.
Filter display object
Application provides the function of filtering display conditions to filter and display the objects in the layer. By setting the Filter Expression, only the Geometry that meets the condition is displayed in the map layer. Please refer to the Displays the Filter for details.
Object Size Filter Display
In the map, some objects that are too small need to be filtered out to avoid affecting Display Speed. For example: Line objects with a screen length of Is no more than20mm in a line layer are filtered out so that they are not displayed in the layer.
Application provides the function of setting the minimum size of display objects, which can filter out the screen length of the minimum Bounds long side length of objects in the map layer. Is no more than Geometry of the set length (except point objects). For how to set the minimum size of display objects, see Filter overlapping small objects .
Layer filter display
Application provides the function of layer filtering display, which mainly refers to Layer Scale filtering display. Includes: Visible Scale for Layer Settings and Using Fixed Scale.
Layer Display Control
In Application, you can control whether a layer is displayed through the "Displayable" function.
There may be dozens or hundreds of layers insome maps, and some layers may not need to be displayed (for example, if a thematic map has been made for a Vector Layer and the thematic map layer is displayed, the original layer may not be displayed), you can cancel the "displayable" layer and filter out the layer. The operation of setting the layer not to be displayed is the reverse operation of enabling the layer to be displayed. Please refer to the Turn on layer display for details.
Layer Scale Filter Display
In map display, it is common to filter layers according to different scales, for example:
- In Current Map, layer A will not be displayed if it is smaller than current scale or larger than current scale; In the
- Current Map, the layer is displayed when the scale is 1:10000 and is not displayed when the scale is 1:50000.
Under different scales, the Application provides the function of setting the visible scale range of the layer, and the user can control the scale range in which the layer is displayed according to the mapping requirements. Please refer to the Set Layer Visible Scale Range for details.
Use Fixed Scale
When the amount of mapping data is relatively large, the speed may be affected when the map is zoomed in and out. The map Display Speed can be increased by setting a series of Fixed Scales on the map.
Set a series of scales, and the system will zoom the map according to the set scale when zooming the map. For example, set four Fixed Scales 1:10000, 1:25000, 1:50000 and 1:100000. If the current scale of the map is 1:30000, the scale will change to 1:25000 after Zoom In, and the scale will be 1:10000 after zooming in. Then the map will no longer be zoomed in; if it is followed by Zoom Out, the scale will change to 1:25000, then to 1:50000, then to 1:100000, and then the map will no longer be zoomed out.
Map Tiles
The Map Tiles function generates a series of cached images for the map according to the set scale and Cache Bounds. When browsing this map, you can directly read the pictures in the cache, thus improving the speed of map display. For the generation and loading of Map Tiles, refer to the Map Tiles chapter.


