


When a vector layer is selected as the current layer in the Layer Manager, the vector parameters setting options appear in the Layer Properties interface. These include functional controls for property settings such as Show Full Line, Intersection, Scale with Map, Minimum Object Size, and Display Filter.
Show Full Line
Show Full Line ensures that the line symbol of a line object can be displayed completely, helping users optimize the display effects of line symbols.
If the length of a line object is less than the periodic length of the line symbol, or if the length of the line object is not an integer multiple of the periodic length of the line symbol, the part of the line that is insufficient for a full symbol period cannot be completely displayed. Using the Show Full Line command will recalculate the line symbol length by integer division, resulting in a length very close to the line object's length for drawing.
As shown in the figure, the line marker style is  . When the line object length is less than one period of the line symbol, the schematic diagrams for using and not using Show Full Line are as follows:
 |
 |
| Not Show Full Line | Show Full Line |
Therefore, the Show Full Line command provides better display effects for line layers with shorter lengths or more polylines, achieving the goal of beautifying the map.
Intersection
For line layers, multiple line objects often intersect, such as in water systems or roads. If left unprocessed and displayed normally, it is not only aesthetically unpleasing but may also not correspond to reality, failing to correctly express the connectivity between intersecting line objects. We often need to optimize intersecting lines, removing overlapping parts at "intersections" to achieve realistic crossroad display effects.
As shown in the figure below, we often need to optimize intersecting lines, removing overlapping parts at "intersections" to achieve realistic crossroad display effects.
 |
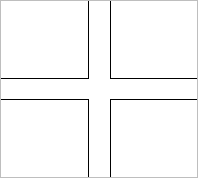 |
| Without Intersection | With Intersection |
- The Intersection function applies to ordinary line layers and network dataset line layers, but not to line layers of CAD data and route data.
- The Intersection function only works for line objects with layer styles that are double-line line types, such as
 . It does not apply to some line symbol types, such as single-line symbols like
  .
.
Enabling Intersection
Check the Intersection checkbox to enable the crossroad function for line-type objects in the current layer. Checking this box applies the intersection effect to lines in the layer; otherwise, the intersection effect is not applied.
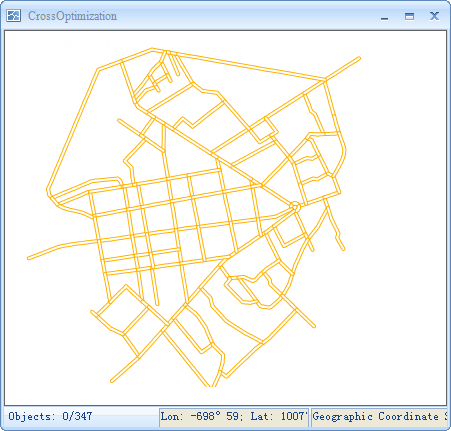 |
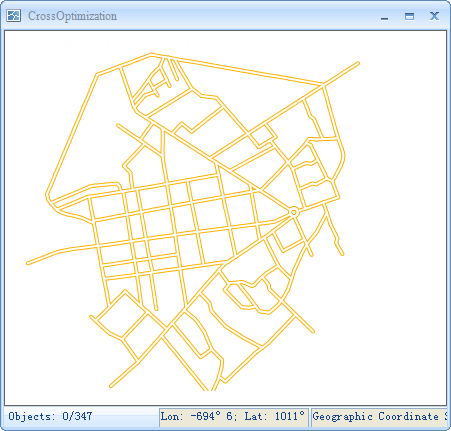 |
| Before Using Intersection | After Using Intersection |
Scale With Map
Used to set whether the map symbol objects in the layer also zoom in or out during map zoom-in and zoom-out browsing operations. The Scale with Map checkbox can be applied to point symbols, line symbols, area symbols, and their borders.
After checking the Scale with Map checkbox, the map symbols in the current layer will scale with the map. The degree of scaling for symbol objects in the current layer during each map zoom operation is determined by both the scaling base scale and the map scale after zooming.
Scaling Base Scale
The degree of scaling for symbol objects in the current layer during each map zoom operation is determined by both the scaling base scale and the map scale after zooming. If the scale of the current map is larger than the scaling base scale, map symbols are enlarged by the same magnification ratio; conversely, map symbols are reduced by the same reduction ratio. For example, if the symbol scaling base scale is 1:500,000 and the symbol size is 30 at that time, then when the map scale is 1:100,000 (i.e., the map is magnified five times), the symbol size will also be magnified five times, becoming 150.
After checking the Scale with Map checkbox, the Scaling Base Scale combo box becomes available. Users can click its drop-down button, select the Set to Current Scale item from the drop-down list to set the current map's scale as the scaling base scale; users can also select the Clear item from the drop-down list to cancel the scaling base scale setting. At this point, the Scaling Base Scale combo box displays as empty, indicating that symbols do not scale with the map.
 Note:
Note:When the scaling base scale is inconsistent with the current map scale, unchecking symbol scaling (i.e., disabling Scale with Map) may cause the symbol size in the current map to change. In this case, symbol display will scale from the size based on the scaling base scale to the size based on the current map scale for display.
Anti-Alias
Anti-alias: When drawing non-horizontal and non-vertical lines or polygon boundaries on a raster graphics display, they more or less appear jagged or stepped. This is because lines, polygons, color boundaries, etc., are continuous, while rasters consist of discrete points. Representing lines, polygons, etc., on a raster display device requires sampling at discrete positions. The information distortion caused by insufficient sampling during reconstruction is called "aliasing." Techniques used to reduce or eliminate this effect are called anti-aliasing.
The Anti-alias checkbox is used to reduce or eliminate the phenomenon of layer information distortion, optimizing layer display effects. Anti-aliasing takes effect only when both map anti-aliasing and layer anti-aliasing are enabled. For Map Anti-alias operations, please refer to: Map Display Optimization.
Show Overlap
Used to control whether to display objects that cause overlapping (occlusion) phenomena. If this checkbox is checked, all objects involved in overlapping will be displayed. The layer show overlap effect takes effect only when the Show Overlap checkbox in the Map Properties panel is also checked. Detailed settings can also be configured in the overlap settings. For specific content, please refer to Overlap Settings in map properties.
Show Full Label
Used to control whether to fully show labels for this layer. The full label display effect for a layer takes effect only after Show Full Label is enabled for the map. It applies only to labels and point symbols.
Minimum Object Size
The text box to the right of the label is used to set the minimum display size for objects in the current layer. When the current map is zoomed in or out, if the larger value between the width and height of the minimum bounds of any geometry in this layer is less than the minimum display size set here, the geometry will be invisible. You can enter a specific value in the text box to the right of the label to set the minimum display size for objects in the current layer. The unit is millimeters.
Rarefy Display
When there are too many nodes on a line object or the boundary line of an area object, rarefy display can be applied to them. This improves map display performance by setting a threshold to thin out nodes within the specified tolerance pixels. Note: Rarefy display settings are only supported for line datasets and region datasets.
- Tolerance (pixels): Sets a tolerance value. Within this value range, if the number of nodes on a line or region object exceeds the set threshold, thinning is performed. The tolerance unit is px. The default tolerance is 0.5, meaning that within 0.5 pixels, if the number of nodes is greater than the default threshold of 500, rarefy display is applied to that object.
- Threshold (count): By specifying a threshold, if the number of nodes within the set tolerance range exceeds this threshold, the object is thinned; otherwise, it is not.
When applying rarefy display to a region dataset, if the set tolerance is too large or the threshold is too small, connections between objects on the map may appear disconnected. This is because rarefy display only controls the display of data within the visible screen area and does not involve the topology between objects.
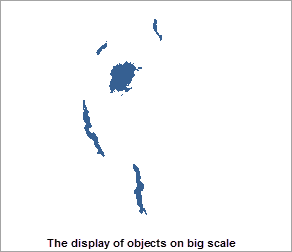
Filter Small Overlapping Objects
Supports setting up filtering for small overlapping objects, specifying that within a tolerance area, only one object is drawn for all small objects smaller than a set size. This reduces the time consumption when displaying a large number of small objects at small scales, improving browsing performance.
Overlapping Small Objects: If both the length and width of an object's Bounds are less than the overlapping small object threshold, the object is considered a small object. Overlapping small objects refer to multiple small objects drawn within a specified unit pixel area (a square region where the side length equals the object minimum size property value). If a small object's Bounds center point is within this square region, it is considered to be in the area. If multiple such small objects exist, they are considered overlapping small objects.
Filter Small Overlapping Objects: Refers to drawing only once per unit pixel area when displaying small objects in the layer. Therefore, only one small object will be displayed in that area, and other overlapping small objects will not be shown.
Filtering small overlapping objects requires setting two parameters: tolerance and object minimum size. The parameter descriptions are as follows:
- Tolerance: This property is used to set the size of the unit pixel area. The valid range for this tolerance value is greater than or equal to 1 and less than or equal to 10, in pixels.
- Object Minimum Size: This property is used to set the size threshold for objects participating in filtering. The valid range for object minimum size is greater than or equal to 1 and less than or equal to 10, in pixels.
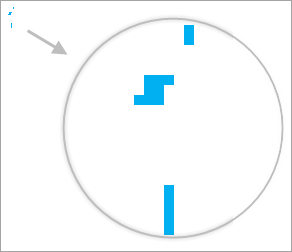
The following schematic diagrams can help you understand the filter small overlapping objects function. Figure 1 shows the display without filtering at large and small scales. Figure 2 shows the display after setting the tolerance to 8 pixels and the object minimum size to 8 pixels for filtering.
 |
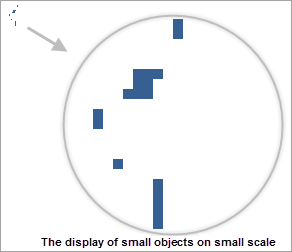 |
| Figure 1: Without Filtering Small Overlapping Objects |
If the overlapping small object tolerance setting is 8 pixels, objects whose Bounds length and width are both less than 8 pixels participate in filtering. The specified unit pixel area is a square region with a side length of 8 pixels, and the starting point for unit pixel areas is the upper-left corner of the map window. As shown in Figure 3, based on the set unit pixel area, the map is divided into a regular grid. Taking drawing objects in the area of row 2, column 2 as an example, assume the object marked with a purple arrow is drawn before the objects marked with red arrows. When drawing the object pointed to by the purple arrow, it is judged as a small object with its center point located within the square area, and it is determined that no other small object has been drawn in this square area, so this small object remains displayed, and the area is marked as having drawn a small object. When drawing the object pointed to by the red arrow, it is also a small object with its center point in the square area. However, since this area is already marked as having a small object, this object is not displayed.
For the default object display order, please refer to Object Display Order Field.
 |
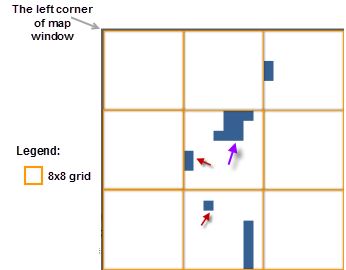 |
| Figure 2: Filter Small Overlapping Objects, Tolerance 8 pixels, Object Minimum Size 8 pixels | Figure 3: Schematic Diagram of Filtering Small Overlapping Objects Process |
Filtering small overlapping objects can reduce the display time consumption of a large number of small objects at small scales. The difference between filtering small overlapping objects and filtering small objects via the Minimum Object Size is: after setting the minimum size for displaying objects, all objects smaller than this minimum size will not be displayed, which may cause large areas concentrated with small objects to have no objects displayed on the map. Filtering small overlapping objects ensures that at least one small object is displayed per unit pixel area, avoiding the problem of large areas concentrated with small objects having no object display.
Display Filter: The spatial combo box is used to set the display filter for the current layer, filtering which objects in the layer are displayed and which are not, allowing users to display features of interest and filter out temporarily unnecessary features based on their needs. For specific operation steps, please refer to: Display Filter.
Object Display Order Field
The draw order of objects affects their display order on the map. Objects in the map are displayed according to the order of values in the set field. Supports setting Multi-Field Display Sorting. Click the button to the right of the object display order display box to pop up the Display Order Field Settings dialog. In this dialog, you can add one or more sort fields and perform operations such as editing and deleting the order of added fields. When multiple fields are added, sorting is first performed according to the first field in the list, then based on the first sorting, sorting is performed according to the second field value, and so on. The order of multiple fields can be adjusted using Bring to Front, Bring to Back, Up, and Down buttons in the lower right corner of the dialog.
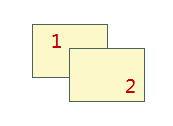
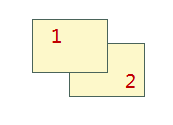
If no sort field is set, the engine's default display order is used, i.e., draw order display. Generally, it takes the SmID field with the same ascending order rule for display. Currently, setting the object display order field is only supported for a single vector layer or a single thematic map layer. As shown in the figure below, object 1 has an SmID of 1, and object 2 has an SmID of 2. Sorting in ascending and descending order according to the SmID field yields the following results:
|
Field
|
Order
|
Diagram
|
|
SmID
|
Ascending
|
 |
|
SmID
|
Descending
|
 |
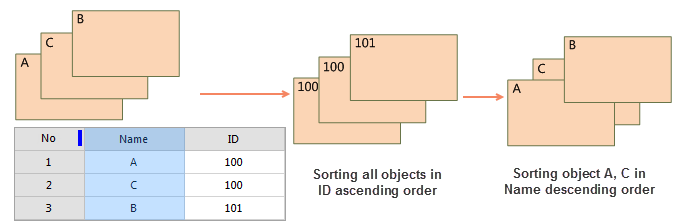
As shown in the figure below: Adjust the display order of three objects A, B, and C. First, perform an initial ascending sort based on the ID field, then perform a descending sort based on the second field, Name, resulting in the outcome shown below.
 |
Note:- After setting the object display order, the Intersection function will become invalid.
- If multiple order fields need to be set, separate each field setting with a comma ",", for example: field1 asc,field2 desc.
- Setting the display order is saved to the current map and workspace, avoiding repeated user settings and improving mapping efficiency.
Setting the Layer Association Property Sheet
Click the Join Attribute Table... button to set the associated field and connect an external table. This allows filtering the display of layer content by constructing a filter involving fields from the external table. For specific operation steps, please refer to: Filtering Display of Objects in the Map.
Set the Output Field
Used to set whether the output fields for generating vector tiles or the fields published as a web map service are visible. Click the Settings Output Fields button to pop up the Set the Output Field dialog. The toolbar provides Bring to Front/Bring to Back and Move Up/Move Down buttons to set the display order of fields. After the tile publishing service, the field display order will be consistent with the order set here.
- Output: Lets you set whether to include this field when the output is a vector tile. Selected: The vector tile result will include this field. Not selected: The vector tile result will exclude this field, effectively reducing data volume and improving transmission and loading performance.
- Services Are Visible: Used to set whether the field is visible after publishing the WMS map service. Selected: After publishing the service, this field is visible. Not selected: After publishing the service, this field will be hidden.
Related Topics
Setting Layer Common Properties
Setting Raster Layer Properties
Setting Image Layer Properties