



Rotation Angle
Rotation angle: The label control is used to set the rotation angle of the map in the current map. You can enter any value in the range [-360, 360] in degrees, accurate to 0.1 degrees. A positive value indicates the map rotates counterclockwise, while a negative value indicates clockwise rotation. After entering the angle value, the current map will rotate accordingly immediately.
When the current map rotates, each rotation operation is performed relative to the original state of the map (i.e., the state without any rotation). The rotation base point is the center point of the visible range of the map in the current map. At the same time, the map rotation operation does not change the data corresponding to each layer in the map.
Map tiles do not support the map rotation angle effect. When the map is set with a rotation angle, the generated raster tiles will have positional offset; the rotation angle is invalid for the generated vector tiles.
Vertex Color
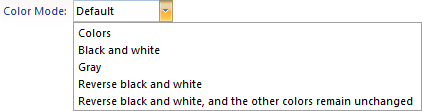
The program provides several preset vertex colors for the map, which can set the vertex color of all vector datasets in the current map. The provided vertex colors include Default, Black and White, Grayscale, Reverse Black and White, Black and White Inverse, and Other Color remains unchanged. The output effect of the map can be previewed immediately after setting.
Background
Supports setting the background of the map. Click the control or the drop-down button on the right to pop up a color panel. You can select the provided default color or click the Other Color button at the bottom of the color panel to customize the color. The background color of the map will apply the currently set color immediately.
Show Settings
The Show Settings in the map properties include display optimization settings for points, lines, area symbols, and text labels. The specific parameter descriptions are as follows:
- Text Minimum/Maximum Size: Used to set the minimum and maximum size of text displayed in the current map, in mm. When the font height of the text in the map is less than the specified minimum size or greater than the maximum size, the text font will not be displayed. When zooming in or out on the map, the font size of the text will also zoom in or out accordingly. However, when zooming in or out to a certain extent, the display of text may lose practical significance. Therefore, these two combo box controls can be used to set the visible state of text in the current map.
- Maximum Visible Nodes: Used to set the maximum number of nodes that can be displayed in the current map. If the number of nodes of a geometry in the current map exceeds the specified maximum visible nodes, the geometry will not be visible.
- Show Overlap
When multiple label features are placed in the map and the map scale is small, areas where text, labels, thematic map elements, etc., are too densely displayed will appear, causing overlapping among these elements and reducing map readability. The overlap settings help users control the display of text, labels, thematic map elements, and other objects in the map, facilitating better handling of overlap display issues of various types of objects in the map, ultimately achieving satisfactory map display effects.
If the Show overlapped objects checkbox is selected, when text overlap occurs in the map, no filtering is performed and all text is shown. If the Show Overlap checkbox is not selected, the map will automatically filter out the later input text based on the overlapping situation of text on the map, thereby avoiding overlap. The show overlap function applies not only to text in the map but also to thematic elements in thematic maps. That is, when overlapping occurs among thematic elements, the checkbox can also control whether to process it.
- Overlap Settings Options
You can control the display between different types of overlapping objects. Overlapping objects can be located in the same layer or in different layers. Note: When two objects overlap, if show overlap is set, the overlapped object at the bottom will be displayed first, and the object on top will not be displayed.
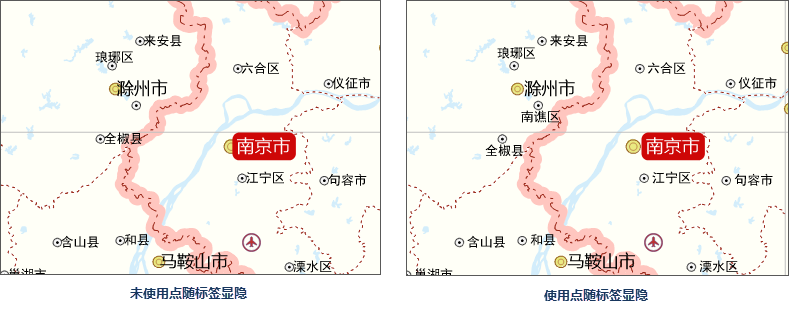
- Show/Hide Points with Text
If points in a point layer are dense, and a label thematic map is created for it, the no overlap function of the label thematic map will remove overlapping labels, causing an illusion that some points have no labels. If no overlap is not used, labels overlap again. The show/hide points with text function controls the filtering display of point layers and the labels of the label thematic map based on that layer. When the "show/hide points with text" checkbox is selected, if the label corresponding to a point is hidden, the point will also not be displayed.
- Display Points Overlapped by Points
When point objects in the same layer or point objects from different point layers are overlapped by other point objects in the map, you can control whether to display the overlapping point objects. Selecting this option means both overlapped and overlapping point objects will be displayed; otherwise, only the point object at the bottom is displayed, and the point object on top will not be shown.
- Display Points and Text That Overlapped Mutually
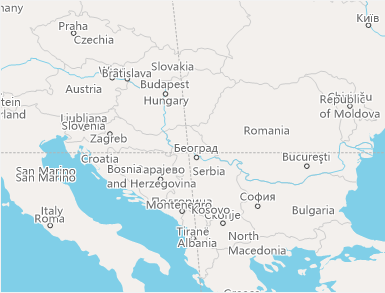
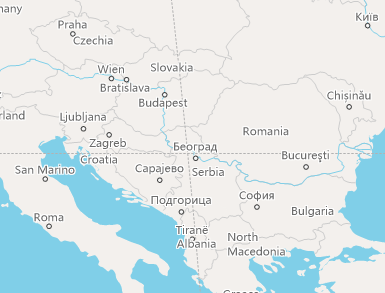
Text includes text annotations of label thematic maps and text of text layers (CAD layers). When point layers overlap with label thematic maps or text layers (CAD layers) in the map, you can control whether to display mutually overlapping objects and text (including labels). Selecting this option means point and text objects that overlap are displayed; otherwise, only the point or text at the bottom is displayed, and objects overlapping on top will not be shown. Note: This option cannot control overlapping between texts or overlapping between point objects.
As shown in the figure below, the left image is the original map, with the Display points and text that overlapped mutually overlap option selected by default; the right image shows the effect of not displaying overlapping points and text. Since the label layer (text) is above the point layer, when points and text overlap, if the Display points and text that overlapped mutually checkbox is selected, the text will be filtered out, and only the point objects will remain.
Display overlapping points and text objects Do not display overlapping points and text objects - Display Text Overlapped by Text
Text includes text annotations of label thematic maps and text of text layers (CAD layers). When text or labels in a label thematic map layer or text layer (CAD layer) overlap, the Display text overlapped by text option can control the overlapping situation. If the Display text overlapped by text checkbox is selected, no processing is performed on overlapping text, meaning all overlapping text is shown; otherwise, display control is performed on overlapping objects, i.e., the object at the bottom is retained, while the object overlapping on top is not displayed. Note: In the label thematic map layer, whether the No Overlap function is executed will be determined first.
As shown in the figure below, the left image is the original map with the Display text overlapped by text option selected, showing all overlapping text; the right image does not have the Display text overlapped by text option selected, only the text at the bottom is displayed, and the overlapping text on top is not displayed.
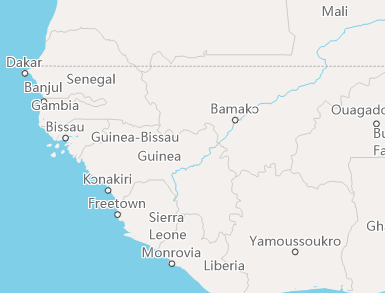
Display text overlapped by text Do not display text overlapped by text - Display the Overlapped Graduated Symbols
Graduated symbols in graduated symbol thematic maps may overlap, and these overlapping objects can come from one or more layers. By setting parameters through the Display the overlapped graduated symbols option, you can control the display of overlapping graduated symbol thematic map elements. If this checkbox is selected, no display control is performed, and all overlapping graduated symbols are displayed; otherwise, overlapping objects are filtered, i.e., only the object at the bottom is displayed, and the object on top is not shown.
- Display the Overlapped Graph Symbols
If statistical symbol thematic maps (such as pie charts and bar charts) in the map have overlapping statistical symbols, these statistical symbols can exist in one or more layers. Through the Display the overlapped graph symbols option in the overlap settings menu, you can control the display of overlapping statistical symbols. If this checkbox is selected, no display control is performed on statistical symbols, and all overlapping statistical symbols are displayed; otherwise, only the statistical symbol object at the bottom is displayed, and the statistical symbol object on top is not shown.
- Overlap Bounds Settings
Overlap Bounds are used to set the overlapping distance between two objects. The range is determined by specifying the width and height. For example, if the width and height of the overlap bounds are set to 60 and 40 respectively, the actual overlap bounds resampling method is based on the bounds of the text, extending 60 units to the left and right, and 40 units up and down. The unit is 0.1 mm. Overlap bounds apply to all five overlap types mentioned above.
When the overlap distance (width or height of overlap bounds) is positive, it indicates the distance between two objects. If the distance exceeds this value, the object is displayed; if it does not exceed, it is not displayed. When negative, it indicates the overlapping distance of two objects. If the distance is less than the absolute value, the object is displayed; if it is not less than the absolute value, it is not displayed.
As shown in the figure below, the left image has no overlap bounds set, and the application controls text display according to the previously set filtering options. The right image shows the display effect after setting overlap bounds (width 20 mm, height 20 mm). The application filters out other objects that fall within this range of each text.
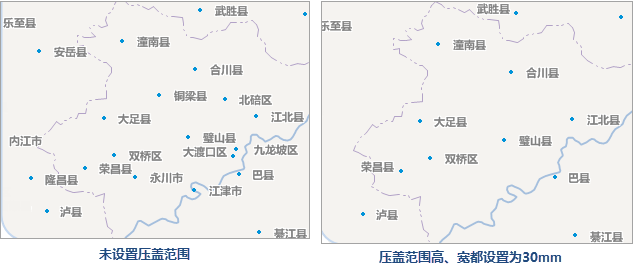
- Show/Hide Points with Text
- Fixed Symbol Angle: Applies to fixing the angle of point symbols in the map. When this checkbox is selected, the angle of point symbols in the current map is fixed; i.e., when the map rotates, the point symbols in the map do not rotate with the map. If the checkbox is not selected, the angle of point symbols in the map is not fixed, and the point symbols rotate with the map. Note: This checkbox is only available when the map's rotation angle is set to a non-zero value.
- Fixed Text Angle: If the Fixed Text Angle checkbox is selected, it indicates that the angle of text in the current map is fixed; i.e., when the map rotates, the text in the map does not rotate with the map. If the checkbox is not selected, the angle of text in the map is not fixed, and the text rotates with the map. Note: This checkbox is only available when the map's rotation angle is set to a non-zero value.
- Fixed Text Direction: If the Fixed Text Direction checkbox is selected, it indicates that the text in the current map is always displayed vertically (as shown in the figure below). When the text direction is fixed, regardless of how the text angle changes, the text is displayed vertically.
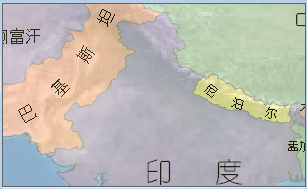
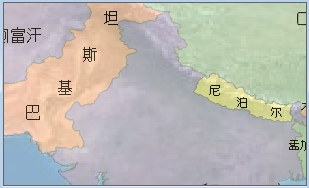
Display effect without Fixed Text Direction checkbox selected Display effect with Fixed Text Direction checkbox selected - Text Antialiasing: Text antialiasing refers to smoothing the strokes of text in the map to eliminate jagged display effects. Enabling text antialiasing can optimize the display effect of text in the map. Both map antialiasing and layer antialiasing must be enabled simultaneously for it to take effect.
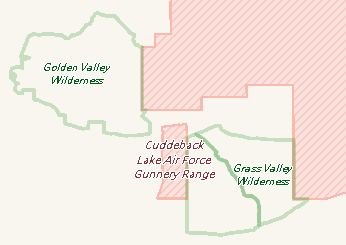
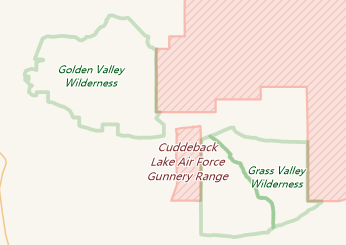
Before setting text antialiasing After setting text antialiasing - Line Antialiasing: Line antialiasing refers to smoothing the lines of vector datasets in the map to eliminate jagged display effects. Both map antialiasing and layer antialiasing must be enabled simultaneously. After enabling line antialiasing, the display effect of line objects, symbol outlines, and area object outlines in the map can be optimized. When the outline linearity is Null, antialiasing is invalid.
- Compatible with Office Font Size
The font display size in SuperMap maps is different from the Microsoft Office font size. For text with the same font size in the map, SuperMap's display standard shows smaller fonts compared to Microsoft Office's standard. In the Map Properties panel, select the Compatible with Office Font Size checkbox to enable font compatibility mode. The text in the map will then be displayed according to the Microsoft Office standard font size. If the checkbox is not selected, the SuperMap font size standard is used.
When a new map window is created, font compatibility mode is enabled by default. When opening a map saved with a version prior to SuperMap iDesktop 7C (V7.1), the checkbox is not selected by default. Users can select the Compatible with Office Font Size option as needed.
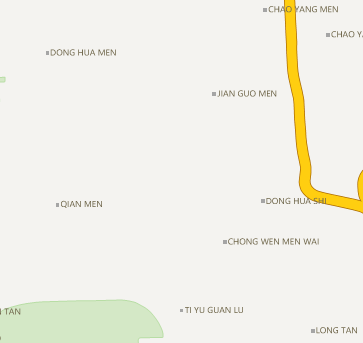
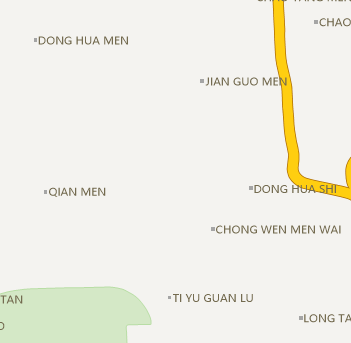
Before enabling Compatible with Office Font Size After enabling Compatible with Office Font Size - Alpha Channel
After enabling the Alpha channel of the map, the A value of the layer color settings takes effect, allowing map features to achieve transparent or semi-transparent effects. Additionally, it supports outputting maps with semi-transparent effects. Layers that support setting the Alpha channel include: vector layers, thematic map layers, and text layers.
- Can be used to adjust colors of the same color family
After selecting the Alpha Channel checkbox in the Map Properties panel, when setting layer colors for points, lines, areas, labels, etc., you can not only set RGB values but also the A value (Alpha value). As shown in the figure below:
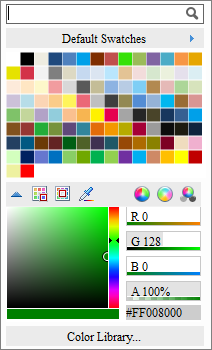
With the same RGB value but different Alpha values, multiple colors in the same color family can be derived. As shown in the figure below, the RGB value of the green land color is set to (137,206,102), and after adjusting different transparency values (Alpha values), the green land color changes.
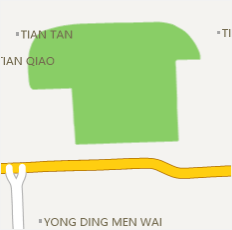
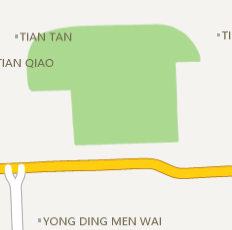
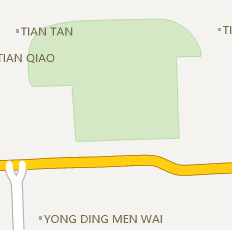
No A value set A value set to 70% A value set to 30% - Creating semi-transparent maps
In practical applications, sometimes a certain patch in a layer needs transparent processing so that features underneath that area are displayed. Alternatively, you may not want some features in the map to completely block the features superimposed below. By setting the Alpha value, you can achieve a semi-transparent effect to meet these application needs.
For example, if a geographical spatial analysis result of a range is overlaid with the map, you can set a semi-transparent effect for the patches of the analysis result, making the features within the analysis bounds more intuitively and clearly displayed, facilitating visual detailing of the analysis result. The figure below shows the service area analysis result overlaid with the map, with the analysis result range set to semi-transparent, clearly reflecting the feature conditions within the covered area:
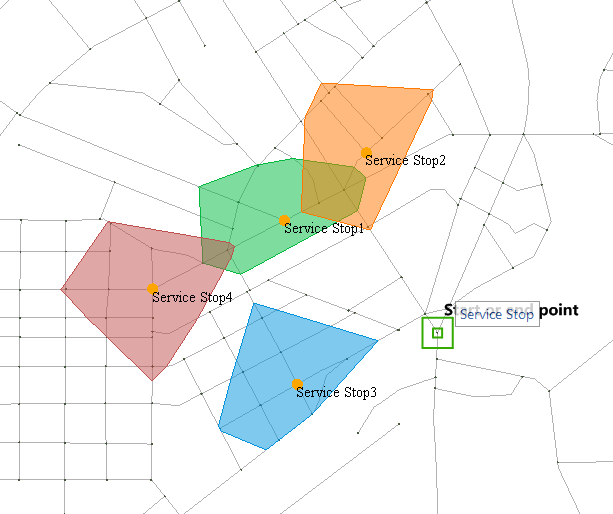
Semi-transparent display of service area - Support semi-transparent map output
In versions prior to 8C, when outputting maps, transparent or semi-transparent map output was not supported. This situation often applies to the output of map tiles. The output tile background is transparent, allowing such map tiles to be well overlaid with other map content. The figure below shows the overlay display of map tiles with a transparent background and a satellite image map:
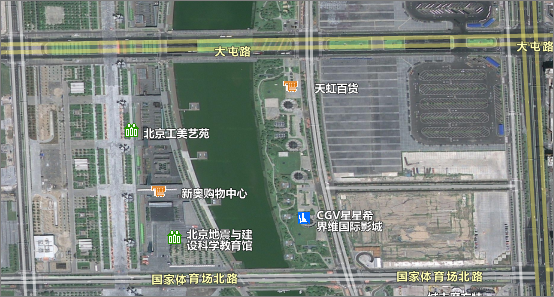
Road and satellite image overlay display  Notes:
Setting the A value of the layer color or attribute table background in the scene takes effect immediately, regardless of whether the Alpha channel in the Map Properties panel is enabled.
- Can be used to adjust colors of the same color family
- Manage Label Weight
Used to uniformly set the display order of label layers and text layers. The higher the weight value, the higher the display priority of the layer. Weight in the layer control is used consistently with Manage Label Weight. Commonly used when multiple label and text layers exist at the same position for display control.
To enable manage weight, you must first select Label Always Top.
Related Topics
Map Properties – Coordinate System