


Automatic vectorization of raster data can greatly improve the efficiency of raster to vector conversion. The raster to vector method is primarily suitable for raster data with clear lines. The specific steps are as follows:
Step 1: Import
Import the raster data to be vectorized; it can be imported as raster or image data. For related content on data import, please refer to the Data Import document.
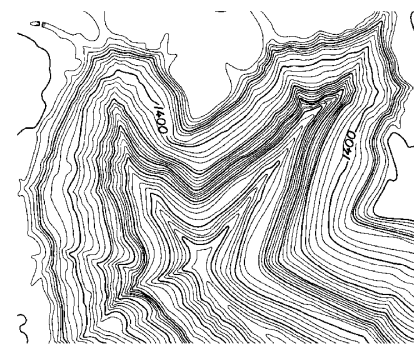 |
| Figure: Imported Raster File |
Step 2: Registration
If the imported raster data lacks spatial position information, registration is required to assign actual spatial positions to the scanned raster data. This involves correcting the coordinates and projection of the raster image to ensure accurate positioning. Registration also corrects distortions caused by various factors during scanning. For detailed information on the registration function, please refer to the Registration topic.
Step 3: Raster Binarization
If the lines in the raster data are clear and simple, binarization is unnecessary. Otherwise, perform binarization using raster algebraic operations: First, observe the difference between lines and background values in the raster data, and set a threshold. For example, if all lines have a raster value greater than 10000 and the background is less than 10000, use the raster algebra expression Con(dem > 10000, 1, 0) to binarize background and line values to 0 and 1.
Step 4: Automatic Raster Vectorization
- In the "Spatial Analysis" tab, within the "Raster Analysis" group, click the "Vector-Raster Conversion" drop-down button, select the "Raster to Vector" option, and the "Raster to Vector" dialog box will appear.
- Select the raster dataset to be vectorized at "Source Data." For raster data that has undergone binarization, choose the binarized dataset.
- In the "Result Data" section, select the data source where the result dataset will be saved, choose the result dataset type (which can be point dataset, line dataset, or region dataset), and set the name for the result dataset.
- If the result dataset type is set to line, configure the corresponding parameters for the line data as described below:
- Smoothing Method: This is only effective when converting raster to vector line data. SuperMap provides two methods for smoothing lines: "B-spline method" and "Corner grinding method." For more details on the smoothing process, refer to the Smoothing Method Description document.
- Smoothness: This is only effective when converting raster to vector line data and when the "Smoothing Method" is not "No Smoothing." The valid range for smoothness depends on the smoothing method. When using the B-spline method, no smoothing occurs if smoothness is less than 2. When using the corner grinding method, smoothness values no less than 1 are valid. A higher smoothness value results in smoother vector lines.
- Thin Raster before Conversion: Selecting this option thins the raster data before vectorization. Thinning reduces the number of cells representing linear objects in the raster data, improving vectorization speed and accuracy. For example, a scanned contour map might use 5-6 cells to display a contour line's width; after thinning, the width is represented by a single cell. Alternatively, pre-thin the grid/image data before vectorization. For details on the raster thinning function, refer to Raster Thinning.
- The parameters in the "Raster Settings" section only take effect when vectorizing raster datasets and do not apply to image datasets.
- No Value: For raster datasets, cells with pixel values equal to this setting are treated as no-value data and excluded from vectorization.
- No Value Tolerance: After setting the "No Value" pixel value, specify this "No Value Tolerance" value. Cells with pixel values within the tolerance range of the "No Value" setting are also excluded from vectorization.
- Raster Value Field: Used to store the raster value of each cell into a field in the result dataset. Specify the field name in the subsequent text box. The default field is "Value."
- Convert Specified Value Only: Only extract and vectorize areas where cell values equal the set value.
- Raster Value: Cells with pixel values equal to this setting participate in vectorization.
- Raster Value Tolerance: Set the tolerance range for the specified "Raster Value." Raster values within the specified value and its floating tolerance range participate in vectorization.
- The parameters in the "Image Settings" section only take effect when vectorizing image datasets and do not apply to raster datasets.
- Background: For image datasets, cells of this color are treated as background and excluded from vectorization.
- Background Tolerance: After selecting a background color for an image dataset, if a cell's RGB values fall within the floating tolerance range of the background color, it is also treated as background and excluded from vectorization. The tolerance value applies to all RGB components. For example, with a tolerance of 10, color values within (R±10, B±10, G±10) are within tolerance. The tolerance range is 0 to 255.
- Click the "OK" button to execute vectorization, or click the "Cancel" button to cancel the operation.
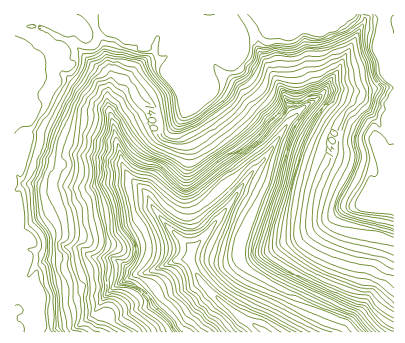
Figure: Raster to Vector Result
Note: The results of automatic conversion often require manual adjustments. Use the "Feature Editing" function to edit the result dataset by adding, deleting, or modifying features. For specific operations, refer to the Feature Editing chapter.