


Feature Description
Raster thinning refers to preprocessing raster data before vectorization to improve the speed and accuracy of vectorization, and it is only applicable to the process of converting raster data to vector line data. The raster thinning function supports both raster data and image data. The raster to vector operation also provides the raster thinning function, meaning that when performing line vectorization on grid/image data, the thinning processing function can be implemented. For information on the raster to vector function, please refer to Raster to Vector.
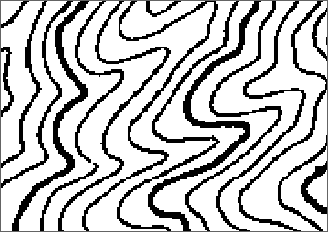
Raster data thinning processing can reduce the number of cells used to represent polylines in raster data, thereby improving the speed and accuracy of vectorization. It is typically used as a preprocessing step before converting raster to vector line data, which can enhance the conversion results. For example, on a scanned contour map (image data), five or six cells may be used to display the width of a contour line; after thinning, the width of the contour line may be represented by only one cell.
 |
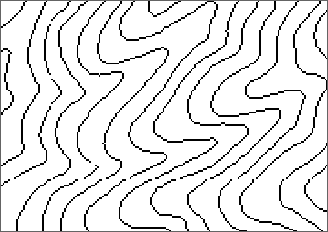 |
| Before raster thinning | After raster thinning |
Function Entry
- Click the Spatial Analysis tab -> Raster Analysis group -> Vector-Raster Conversion -> Raster Thinning.
- Toolbox -> Raster Analysis -> Raster Integration -> Raster Thinning.
Parameter Description
- Source Dataset: Sets the source data to be processed. Select the data source where the raster data is located and the raster dataset to be operated on.
- Sets the parameters for raster thinning.
- No Value: Due to different data types selected, the meaning of "no value" varies. The following describes them separately:
- Raster Data: The value that is set as null in the resulting dataset. If a cell value becomes "no value" after raster thinning, it is assigned -9999. Cells set as "no value" do not participate in the calculation during raster thinning. When a line is represented by multiple cells and only one cell is displayed after thinning, the other cell values are filled with this "no value". When using iDesktop, users can click
 to pick a value from the opened raster dataset and set it as "no value". Users can also directly input a raster value from the opened raster dataset.
 - Image Data: The specified cell value of the image data is treated as "no value". Cells set as "no value" do not participate in the calculation during raster thinning and will not be converted. The default value of "no value" is related to the pixel format of the image dataset: the default "no value" is the maximum value in the data range corresponding to the pixel format. For example, if the pixel format of the image data is 24-bit true color, the dataset can represent integer values from 0 to 16,777,215, totaling 16,777,216 values, then the default "no value" is 16,777,215. When using iDesktop, users can click the pickup button to pick a value from the opened raster dataset and set it as "no value". Users can also directly input a raster value from the opened raster dataset.
- Raster Data: The value that is set as null in the resulting dataset. If a cell value becomes "no value" after raster thinning, it is assigned -9999. Cells set as "no value" do not participate in the calculation during raster thinning. When a line is represented by multiple cells and only one cell is displayed after thinning, the other cell values are filled with this "no value". When using iDesktop, users can click
- Tolerances:
- Raster Tolerance: Sets the tolerance for no-value data in raster. Assuming the no-value is set to r and the tolerance value to a, the range for no-value data is [r-a, r+a].
- Image Tolerance: Sets the RGB tolerance for no-value data in images. For example, when thinning an 8-bit unsigned image, setting 0 as no-value, a no-value cell with value 0 has RGB (250,250,050). If the image tolerance settings are (R:2,G:2,B:3), cells with RGB values in the range (248,248,252) to (252,252,253) are all considered no-value.
- Result Data: Sets the result data parameters. Select the data source where the processed result will be saved and the resulting dataset name.
- No Value: Due to different data types selected, the meaning of "no value" varies. The following describes them separately:
Application Example
The data used in this case is located in the "Terrain" data source in SuperMap sample data SampleData\ExerciseData\RasterAnalysis. A separate installation package needs to be downloaded. For details, please refer to Get Sample Data Package.
Using the RasterForLine data after contour rasterization, after setting the raster thinning parameters, the result shown in the following figure is obtained.
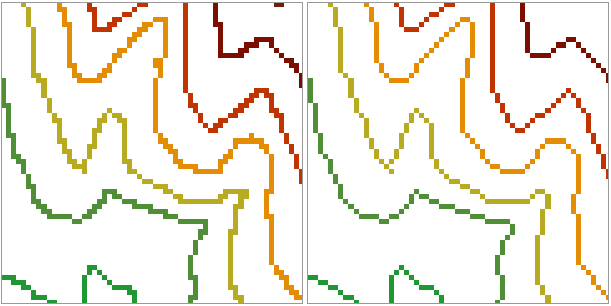 |
| Figure: Comparison of Thin Raster Results |
 Notes:
- The tolerance for no-value is the tolerance of the value specified by the user as no-value, and it is unrelated to the original no-value in the raster.
- It is recommended that users click the pickup button to pick a value from the opened raster dataset and set it as "no value". If the "no value" input by the user does not exist in the dataset's cell values, the calculation result may be incorrect, or raster thinning may not be performed.
Related Topics