



Raster To Vector
Feature Description
Vectorize raster data type datasets, converting raster datasets into point, line, or region datasets.
Open the "Terrain" datasource under the "ExerciseData/RasterAnalysis" folder, which contains DEM data with a resolution of 100 meters. We will use this data as an example.
Feature Entry
- Spatial Analysis tab > Raster Analysis group > Vector-Raster Conversion > Raster to Vector.
- Toolbox > Raster Analysis > Vector-Raster Conversion > Raster to Vector.
Parameter Description
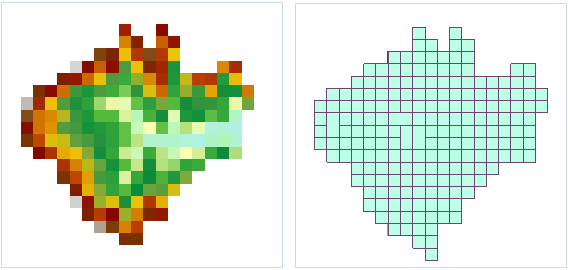 |
| Figure: Raster to Vector Result |
- In the "Source Dataset" area, select the dataset to be processed.
- Datasource: The dropdown list on the right shows all datasources in the current workspace. Select the datasource containing the raster dataset to be vectorized.
- Dataset: The dropdown list on the right shows raster datasets and image datasets in the selected datasource. Select the dataset to be vectorized.
- In the "Result Data" area, specify the location and name of the result dataset after vectorization.
- Datasource: Select the datasource location where the generated result dataset will be saved.
- Dataset Type: Select the type of the generated result dataset, which can be a point dataset, line dataset, or region dataset.
- Dataset Name: Name the result dataset generated after vectorization.
- "Vector Set": Smooth the result dataset. This option is only available when the result dataset is a line or region.
- Smooth Method: You can select "B-Spline" or "None". For more information about the smoothing process, refer to the Smooth Method Description document.
- Smoothness: The valid value of smoothness depends on the smooth method. When the smooth method is B-Spline, if the smoothness value is less than 2, no smoothing will be performed. The larger the smoothness value, the higher the smoothness of the resulting vector dataset.
- Thin Raster Before Conversion: Select this option to perform thinning on the raster data before vectorization. Thinning can reduce the number of cells representing linear objects in the raster data, improving the speed and accuracy of vectorization. For example, a scanned contour map might use 5 or 6 cells to represent the width of a contour line. After thinning, the contour width is represented by only one cell. You can also preprocess grid/image data with thinning before vectorization. For more information about the raster thinning function, please refer to Raster Thinning.
- The parameters in the "Raster Settings" area only take effect when vectorizing raster datasets, not when vectorizing image datasets.
- No Value: For a raster dataset, cells with pixel values equal to this set value are considered as no-value data and are excluded from the vectorization process.
- No Value Tolerance: After setting the no-value pixel value, this tolerance value defines the range. Cells with pixel values within this tolerance range (including the set value) are also considered no-value data and are excluded from vectorization.
- Grid Value Field: Used to store the raster value of each cell into a field of the result dataset. Specify the field name in the text box below. The default field name is "value".
- Convert Specified Value Only: Only extract areas where the cell value equals the set value for vectorization.
- Raster Value: Cells with pixel values equal to this set value participate in the vectorization process.
- Raster Value Tolerance: Set the tolerance range for the specified "raster value." Raster values within this specified value plus the floating tolerance range participate in the vectorization process.
- The parameters in the "Image Settings" area only take effect when vectorizing image datasets, not when vectorizing raster datasets.
- Background: For an image dataset, if a cell with this color is encountered, it is treated as the background color and is excluded from the vectorization process.
- Background Color Tolerance: After selecting the background color for an image dataset, if the RGB value of a cell in the dataset falls within the floating tolerance range of the background color, that cell is also treated as background color and is excluded from the vectorization process. The tolerance value applies to all three RGB values. For example, if the tolerance is set to 10, then color values within the range (R±10, B±10, G±10) are considered within tolerance. The tolerance value ranges from 0 to 255.
- Environment Settings: Set analysis environment parameters. The raster to vector function supports setting analysis environment parameters such as the geographical extent of the resulting dataset, clip bounds, default cell size, etc. For detailed operations, please refer to the Setting Analysis Environment page.
Note: It supports setting the environment parameters as global. This means the parameter values set here will be used as the global raster environment analyst parameters. Other functions supporting environment parameters do not need to set them again. If no environment parameters are set here, the analysis will read the corresponding parameter settings from the raster analysis environment.
Related Topics