


The Average Nearest Neighbor method calculates a nearest neighbor index based on the average distance from each feature to its nearest neighboring feature. It provides the nearest neighbor index where values less than 1 indicate clustered patterns, while values greater than 1 suggest dispersed patterns. If the observed average distance is smaller than the expected mean distance under random distribution, the analyzed features are considered clustered. Conversely, if larger, they are deemed dispersed. This method quantifies aggregation levels, enabling comparisons of clustering intensity across different datasets.
The Average Nearest Neighbor method is highly sensitive to area values. It works best for comparing different features within fixed study areas. When no area is specified, the minimum bounding rectangle area of the dataset will be used as default.
Application Scenarios
- Assessing competition or territories: Quantify and compare spatial distributions of plant/animal species in fixed study areas; compare average nearest neighbor distances between different business types in urban areas.
- Monitoring temporal changes: Evaluate changes in spatial clustering of specific business types over time within fixed study areas.
- Comparing observed vs control distributions: In timber analysis, compare harvested areas with harvestable areas to determine if logging patterns are more clustered than expected.
Feature Entry
- Spatial Statistics Tab -> Analyzing Patterns -> Average Nearest Neighbor.
- Toolbox -> Spatial Statistics -> Analyzing Patterns -> Average Nearest Neighbor.
Parameter Description
- Source Dataset: Specifies the vector dataset (point/line/region) for analysis.
- Study Area: Defines study area size in square meters (≥0). If set to 0, uses the minimum bounding rectangle area of the source dataset.
- Measure Distance Method: Options include Euclidean distance and Manhattan distance. For details, refer to Spatial Statistics Basic Vocabulary.
Result Interpretation
Results are output as CAD datasets and displayed on the map.
Analysis results include five parameters: Nearest Neighbor Index, Expected Mean Distance, Observed Mean Distance, z-score, and p-value. The Nearest Neighbor Index is the ratio of observed to expected distances. Values <1 indicate clustering, while >1 suggest dispersion. As shown below:

Example
Sample Data: Click to download sample data (requires extraction after download).
Comparing clustering degrees between residential communities (Residence) and villas (Villa) in a region, analysis results show:
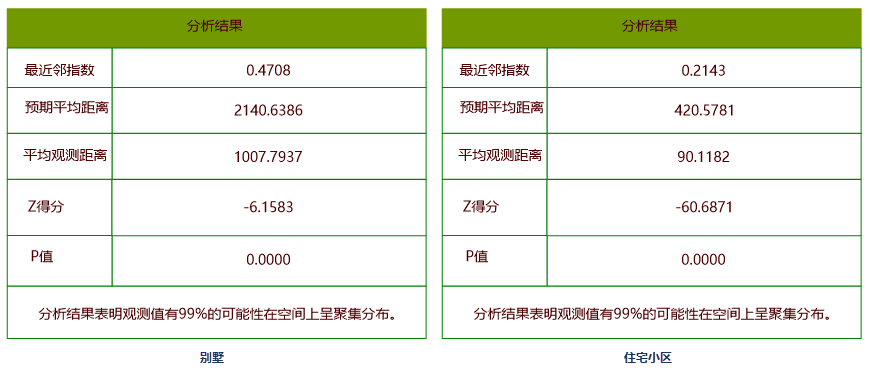
Residential communities have a nearest neighbor index of 0.2143, while villas score 0.4708. Both <1 values indicate clustered distributions, with residential areas showing stronger clustering.
Related Topics
Incremental Spatial Autocorrelation