


The uneven spatial distribution of socio-economic factors, land use, biodiversity, and climatic characteristics manifests as spatial heterogeneity in the diversity of natural and socio-economic development processes. Spatial heterogeneity, also known as spatial stratified heterogeneity, refers to geographical phenomena where within-stratum variance is smaller than between-stratum variance, typically expressed through classification or zoning. Examples include geographical regions, climate zones, land use maps, and national functional zoning plans. Various habitats such as landforms, soil types, and climate provide refuges for numerous species, making spatial stratified heterogeneity crucial in geographical studies.
The Geographic Detector is a spatial analysis method for identifying spatial heterogeneity and revealing its underlying driving forces. Its core premise is based on the hypothesis: if an independent variable significantly influences a dependent variable, their spatial distributions should exhibit similarity. This method offers two key advantages: 1) It can analyze both numerical and categorical data. 2) It detects interactive effects between two factors on the dependent variable. By comparing individual q-values and combined q-values of factors, it identifies interaction types, strengths, directions, and linear/nonlinear relationships. Interactions include multiplicative relationships and other associations detectable through superposition.
Note: Theoretical principles and case studies are cited from: Wang Jinfeng, Xu Chengdong. Geographic Detector: Principles and Prospects[J]. Acta Geographica Sinica, 2017, 72(1): 116-134. (URL: http://geoscien.neigae.ac.cn/article/2017/0375-5444/0375-5444-72-1-116.shtml)
Functional Principle
The Geographic Detector analyzes spatial stratified heterogeneity through four components (Factor Detector, Risk Detector, Ecological Detector, Interaction Detector), addressing these questions: ① Does spatial heterogeneity exist? Which factors cause it? ② Are there significant regional differences in variable Y? ③ What is the relative importance between factors X? ④ Do factors X act independently or interactively on Y?
Stratification and Factor Detection
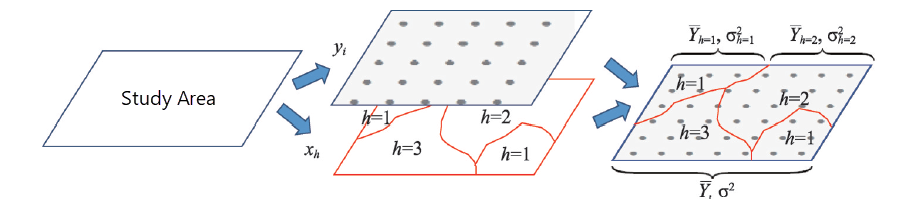
This detects Y's spatial heterogeneity and quantifies how much factor X explains Y's variation using q-value (Wang et al.,2010b):
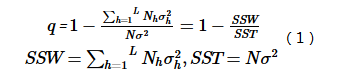
Where h = 1, ..., L denotes strata of Y or X; Nh and N are unit counts in stratum h and entire area; σ2h and σ2 are variances of Y in stratum h and overall. SSW and SST represent within-stratum and total sum of squares. q ∈ [0,1], with higher values indicating stronger spatial heterogeneity. If strata derive from X, higher q implies greater explanatory power. q=1 means X fully controls Y's distribution; q=0 indicates no relationship.
A transformed q-value follows non-central F distribution (Wang et al.,2016a):
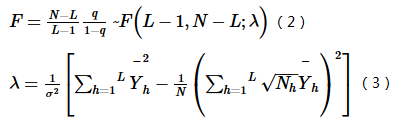
Where λ is non-central parameter; Yh is stratum h's mean.
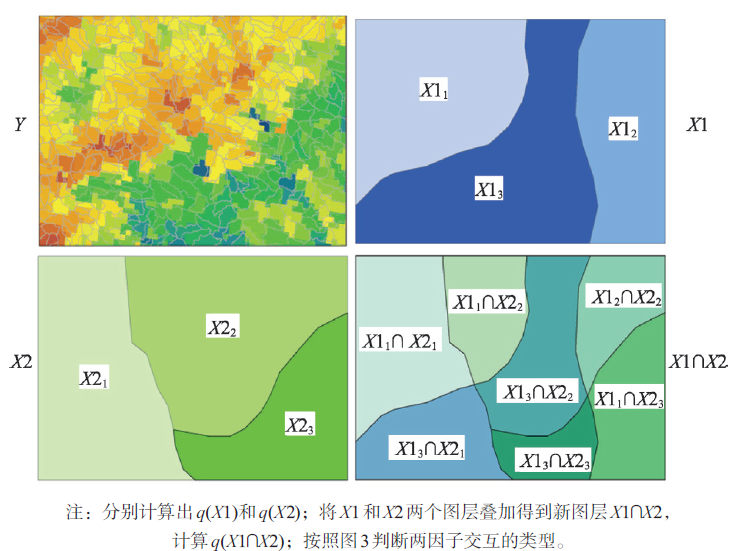
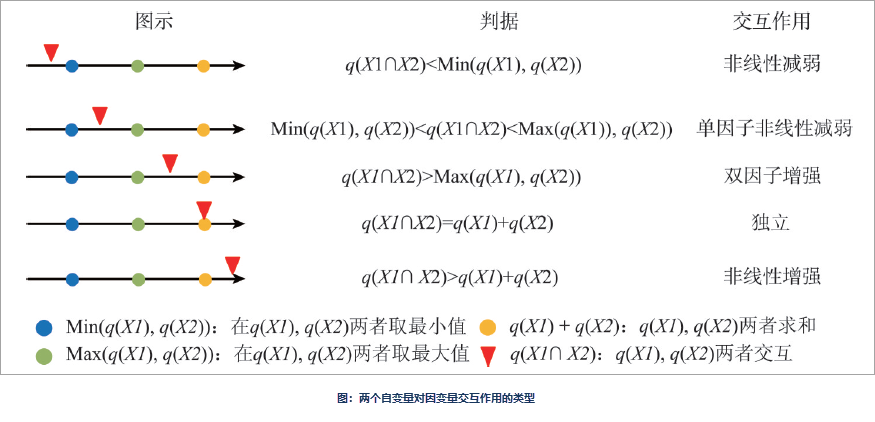
Interaction Detection
Identifies interactions between factors X1 and X2 by comparing q(X1), q(X2), and q(X1∩X2). Interaction types include:
Risk Detection
Tests whether attribute means differ significantly between subregions using t-statistic:
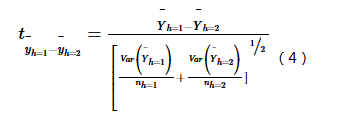
Where Yh is attribute mean in subregion h; nh is sample count. t follows Student's t distribution with resampling-derived degrees of freedom:
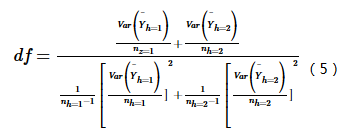
Rejecting H0: Yh=1=Yh=2 at α level indicates significant difference.
Ecological Detection
Compares X1 and X2's impacts using F-statistic:
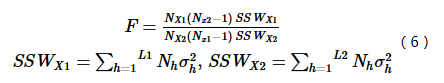
Where NX1, NX2 are sample sizes; SSWX1, SSWX2 are within-stratum variances; L1, L2 are stratum counts. Rejecting H0: SSWX1=SSWX2 implies significant difference in explanatory power.
Feature Entry
- Spatial Statistics Tab -> Analyzing Patterns -> Geographic Detector.
- Toolbox -> Spatial Statistics -> Analyzing Patterns -> Geographic Detector.
Key Parameters
- Source Dataset: Input dataset (point, line, region, or attribute table).
- Dependent Variable Field: Numerical variable being explained (e.g., NTDs incidence rate).
- Independent Variable Fields: Categorical explanatory variables (e.g., soil type, elevation). Numerical variables require discretization (k-means, expert classification). Each stratum must contain ≥2 samples.
- Result Data: Datasource to store four output tables.
Result Interpretation
Results are saved as tabular datasets and displayed in the right panel:
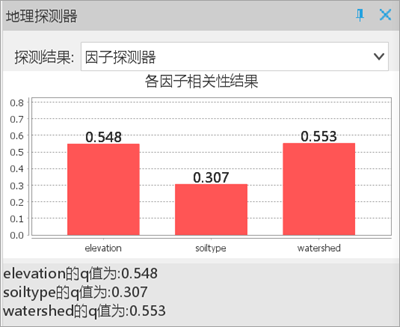
- Factor Detector: Quantifies Y's spatial heterogeneity via q-value. Higher q indicates stronger explanatory power. Output: FactorDetector_result.
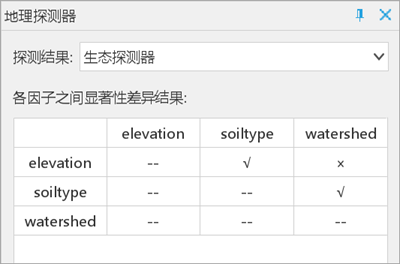
- Ecological Detector: Compares factors' impacts using significance tests. "√" indicates significant difference. Output: EcologicalDetector_result.
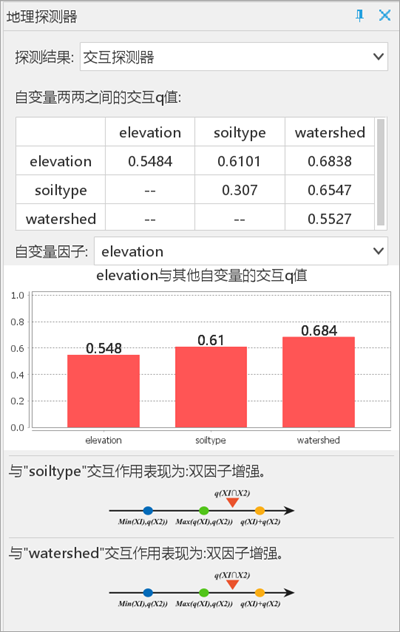
- Interaction Detector: Identifies interaction types (Weaken/Enhance/Independent). Output: InteractionDetector_result.
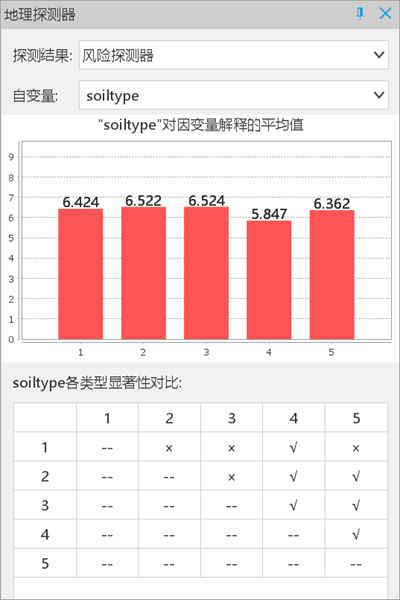
- Risk Detector: Tests regional mean differences via t-tests. Output: RiskDetector_result.
Case Study
Sample Data: Download GeoDetector Case Data (extract after download).
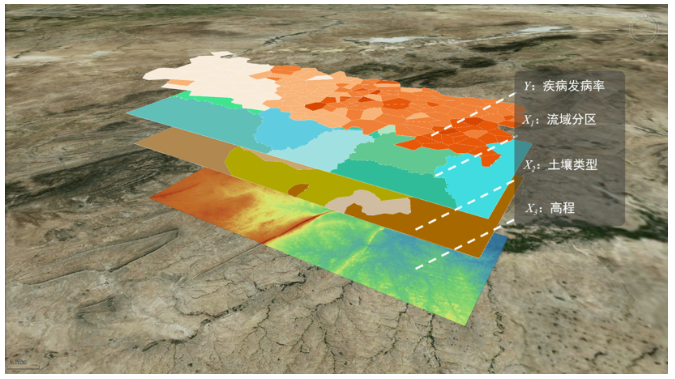
Analyzing NTDs incidence with environmental factors (soil type, elevation, watershed):
Results:
- Factor Detector: Watershed shows highest q-value, being the dominant factor.
- Ecological Detector: Soil type differs significantly from others.
- Interaction Detector: Elevation interactions show bi-enhancement effects.
- Risk Detector: Soil type strata show varying NTDs rates (α=0.05).
 Related Topics
 Incremental Spatial Autocorrelation