


Before playing temporal data, you need to set the time attribute of temporal data. For details, please refer to the Enable Time for Data page.
Temporal Data Player
In the temporal player, the timeline determines the start and end time range of temporal data playback. Click to play to start playback. The time slider will move on the timeline by one grid each time, and the map will be refreshed once. The time spanned by moving one cell is equal to Time Step.
Alternatively, you can drag the time slider or click Previous Frame/Next Frame to view the data at a point in time. (The map is displayed one frame before the time slider moves from the current timescale to the next timescale.)
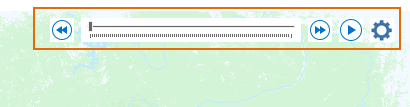 |
| Figure: Layer Player |
- Play/Pause: Click the Play button to autoplay all steps from the current position of the slider control to the end of the slider range. Click the Pause button to stop playback and leave the slider control at the last playback position.
- Previous Frame: Click the "Previous Frame" button to review the layer status of the previous time scale.
- Next Frame: Click the Next Frame button to view the layer status for the next time scale.
By default, the system queries the time field of all the time-enabled and visible layers, and takes the minimum and maximum values of the time value as the start and end time of the timeline respectively; the user can also customize the start and end time of the timeline. The scale interval of the timeline is equal to Time Step, and the scale value is the start time of the timeline plus the scale interval time, and so on. For example, if the start time of the timeline is 2011/07/23 06:00:00, and the scale interval is 6 hours, then the start scale value of the timeline is 2011/07/23 06:00:00, and the next scale value is 2011/07/23 12:00:00. The Display Time range of Current Windows can be calculated based on the scale value of the time slider on the timeline, as described in the next section, "Playback".
Set the Playback Parameters
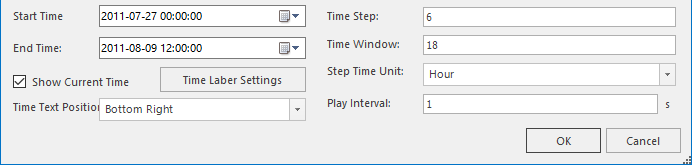 |
| Image: Play Settings |
Play
When playing, the time slider slides on the timeline according to the time interval set for each frame, and the system obtains the Display Time range of the Current Windows (current frame) according to the time scale to which the time slider moves, the Time Step of the display data, and the time window. The system queries the time-enabled and visible layer to determine whether the time value of the object is within the Display Time range of Current Windows. There are two types of situations:
For example, if the time slider is moved to the 2011/07/23 06:00:00 time scale, the Time Step of the displayed data is 6 hours, and the time window of the displayed data is 12 hours, then the Display Time range of the current map can be determined as: 2011/07/22 18:00:00-2011/07/23 12:00:00; For a layer with a single time field, the time value of an object is 2011/07/22 21:00:00. It can be judged that the time value is within the Display Time range of Current Windows, so the object needs to be displayed; For the layers with two time fields, the start and end time values of an object are 2011/07/22 15:00:00 and 2011/07/23 8:00:00 respectively. The time range of the object (2011/07/22 15:00:00, 2011/07/23 8:00:00) intersects with the Display Time range of Current Windows, so the object is also displayed.
The following is the satellite cloud image at each observation time of a certain day in Mosaic Dataset. Set the time field in the profile attribute table to record the observation time of the cloud image. Set the step interval of the playback parameter as 1 hour, the time window as 1 hour, and play the data at the speed of 0.5 seconds. The following playback results are obtained:
 |
| Figure: Satellite Cloud Image Playback at Each Observation Time of a Day in Mosaic Dataset |
Output as GIF
SuperMap desktop supports outputting the playback process of temporal data as GIF and Export Bounds as Current Map Window Extent.
Operating Instructions: After setting the playback parameters of temporal data, click to play the "Save as GIF" button on the rightmost side of the toolbar, and specify the save path and name of the GIF. Output it as a *.gif file.
Note: Set the GIF range to Current Map Window Extent. It is recommended that the user adjust the map range and map scale before outputting.
- Time Step
Time Step is the time that the time slider moves one space on the timeline. For example, if the temporal data of the typhoon track point is displayed and the Time Step is set to 6 hours, then the time slider moves by one division, that is, 6 hours ahead. If the time slider moves from the 2011/07/23 06:00:00 timescale to the 2011/07/23 12:00:00 timescale, Current Windows should display temporal data with a time range of (2011/07/23 06:00:00, 2011/07/23 12:00:00), and so on. When the time slider is moved to the 2011/07/23 12:00:00 timescale, the time range of temporal data displayed by Current Windows should be (2011/07/23 12:00:00, 2011/07/23 18:00:00).
If the map contains more than one time-enabled layer, the Data Time Step of the layer is also different. By default, the Time Step of the playback data is equal to the Data Time Step of the smallest layer. The Time Step for playing the data can be set by the user.
- Time Window
The time window defaults to 0. In this case, as the time slider moves on the timeline, the current map displays the time range of temporal data as (current time point, current time point + time step). For example, the time slider moves to the 2011/07/23 06:00:00 time scale. Then, the time range of the current map showing temporal data is (2011/07/23 06:00:00, 2011/07/23 12:00:00). If you set a time window, for example, a time window equal to 12 hours, objects within 12 hours of the current timescale of the Time Slider will also be displayed. For example, if the time slider moves to the 2011/07/23 06:00:00 time scale, the Time Step is 6 hours, and the time window is 12 hours, then the current map shows that the temporal data time range is 2011/07/22 18:00:00-2011/07/23 12:00:00.
- Time Frame
By default, the system will calculate the minimum time and maximum time as the time range for displaying temporal data, that is, the Start Time and End Time of the timeline, according to the time fields of all the start time and visible layers; You can also customize the time range in which temporal data is displayed to change the start and end time values of the timeline.
- Playback Interval
The time slider moves one space on the timeline, and the map will refresh once. From the end of the previous refresh to the end of the next refresh, the content displayed by the map is called a frame. The actual time spent displaying a frame can be controlled by setting the playback speed.
- Show Current Time
In Map, by checking "Show Current Time", you can display the time range of the current frame in the map, set the text style of the time range, and control the display position of the time text in the map. Nine positions are supported here.
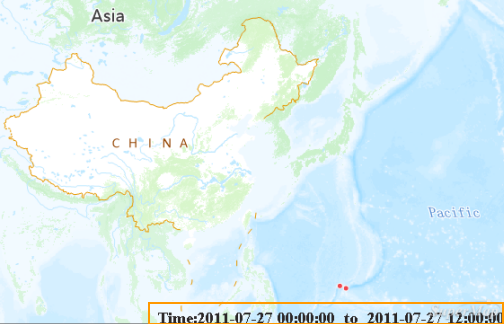
Figure: Time Text on Map - For layers with a single time field assigned, the object is displayed only if the value of the time field is within the Display Time range of Current Windows; otherwise, it is not displayed.
- For layers with two specified time fields (start time field and end time field), if the time interval formed by the start and end time field values intersects with the Display Time range of Current Windows, the object will be displayed; otherwise, it will not be displayed.
Related Topics