


3D dynamic plotting is mainly used to achieve three-dimensional graphical plotting for command and dispatch schemes such as military operations, emergency response plans, and public security encirclement operations by combining with digital maps. By using various graphics and model symbols with special meanings provided by the 3D graphics markup panel, it can intuitively and accurately display event handling plans on a 3D scene, improving the efficiency of consultation and communication during emergency response processes.
3D dynamic plotting provides a symbol library created according to relevant industry standards, which can fully support graphic application needs in industries such as military, public security, armed police, and emergency response. The police graphic symbol library is shown in the figure below.
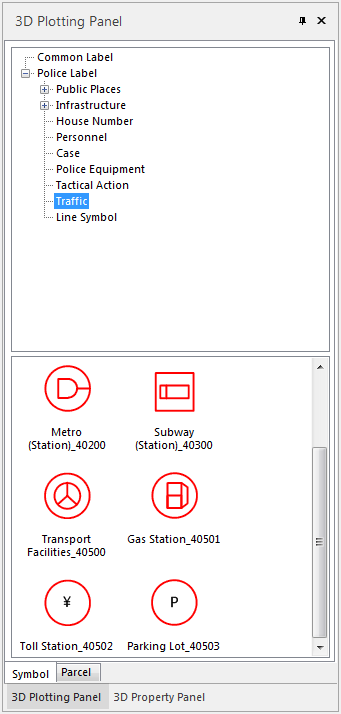 |
| Figure: 3D Plotting Panel |
Graphic symbols can be selected in a 3D scene to perform operations such as moving and node editing, enabling interactive graphical editing. The figure below illustrates the editing interface for point, line, and region symbols in the scene.
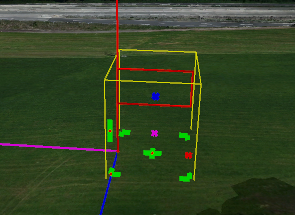 | 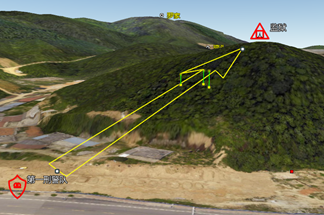 |
| Figure: Vector Symbol Editing Mode for Point Symbols | Figure: Line and Region Symbols Editing Mode |
For a detailed introduction to graphic symbols, please refer to: View and Edit Graphic Symbols.
Situation simulation is an important function of 3D plotting. The desktop product mainly supports the following seven types of situation simulation animations:
- Properties: Gradual change from the set start state to the end state over a specified time. You can set the main line color, main line width, surrounding line color, width, etc.
- Twinkle: Blinking by switching colors or visibility at the set symbol blinking interval.
- Path: The symbol moves along the set trajectory and direction.
- Rotation: Rotate from the set start angle to the end angle over a specified time.
- Scale: Scale to the specified ratio over a set time.
- Visibility: Can set whether the symbol is visible within a certain time.
- Growth: Can set the growth ratio and growth time to complete symbol growth within the specified time.
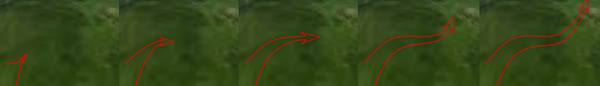 |
| Figure: Growth Demonstration |
In SuperMap desktop products, when you create or open a spherical scene, the "3D Plotting" tab will be displayed. The functions in this tab are introduced as follows:
Markup Panel
Used to display a symbol panel for common symbols, police symbols, and primitives. When the CAD layer is editable, you can directly select a symbol or primitive to draw.
Properties Panel
Used to display the attributes of the selected symbol or primitive, supporting direct modification of its properties.
Situation Simulation Manager
Used to create the seven types of supported situation simulation animations.