The draw time is the time to Show in Map, render the object. To optimize the drawing time is to improve the display efficiency of map elements. We can start from the two aspects of optimizing Dataset and optimizing map display. The details are as follows:
Optimize Dataset
The optimization scheme of Dataset can be divided into the optimization of Vector Dataset and Raster Dataset. Vector Dataset can start from the aspects of Data Type, Field Index, data repeatability, data complexity, and data error troubleshooting; Raster Data can be optimized by Create Pyramid.
Vector Dataset:
- Dataset Type
Maps should use Simple Dataset as much as possible and CAD Dataset as little as possible. Because Simple Dataset does not need to store Object Style and has a smaller amount of data than CAD.
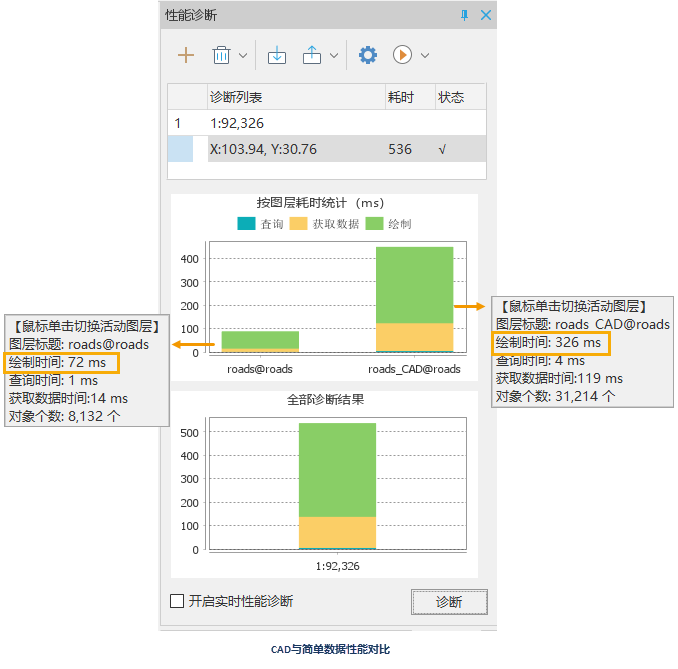
For example, test the three-level road map data in a certain area. The road data is stored by using simple Line Dataset and CADCAD respectively. Test the efficiency of Refresh Map once in the two cases. The results are shown in the following figure. Under the same conditions, the refresh time of the simple Line Dataset is about 72 ms, and that of the CAD Dataset is about 326 ms. It can be seen that the drawing and query time of the simple type Dataset is less than that of the composite type Dataset with the same content and amount of data, so the simple type data should be used as much as possible in the map.
- Field Index
Field Index provides the ability to quickly access the data of a specific key value. Field Index generally uses a binary tree or a derivative data structure of a binary tree. If a field in the Dataset needs to be used for SQL Query, analysis, thematic map production, Filter Expression and other functions, you can Create Field Index for the field. After Create Field Index, the efficiency of map drawing can be improved.
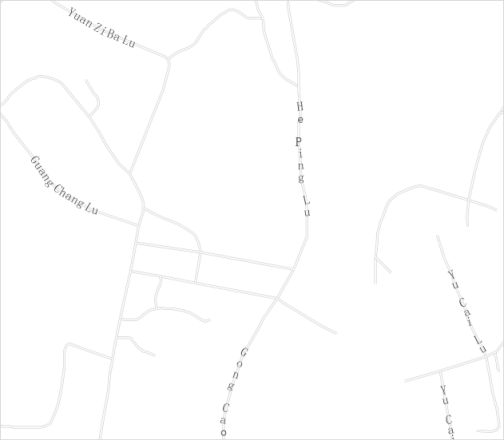
For example, if the Road _ L line data is to be used to make the Thematic Label Map, and the Create Index field in the data is not used, it takes 94 ms to draw the diagnostic layer. After the Create Field Index of the NAME field used to make the Thematic Label Map, the layer drawing time was 44 ms, and the drawing time of the layer was reduced. This shows that the Field Index of Create Dataset can improve the drawing efficiency of layers.

- Data Error
Data errors include Layer Bounds error and unreasonable data, which are described as follows:
- Layer Bounds Error One of the main reasons for the
Layer Bounds error is the data with abnormal coordinates. How to check the Layer Bounds error or what is the appearance of the Layer Bounds error? The method is as follows: Add a single Dataset
in the Create Map Window and perform Full View to check the correctness of Layer Bounds. If the main area of the map shrinks to a small area, there may be data with abnormal
coordinates. InCheck Data, the coordinates are SMX and SMY in Point Dataset, and the four fields SmSdriW, SmSdriN, SmSdriE and SmSdriS in Line Region Dataset. The ascending and descending order of field columns can be used to check whether there is abnormal data.
- Data Rationality
The following data conditions will affect the display efficiency of the map:
- In
- maps, there are many data layers with more than one million records.
- There are a large number of layers, but too few Records in each layer.
- There are a large number of roads with a length of less than 10 meters, rivers or parks with an area of less than 100 square meters.
- The first
- problem is to separate the data as much as possible, either by Data Type or by geographical location.
- Problem 2: Merge Datasets of the same type.
- Question 3: Determine the standard of the minimum length or area. For example, the length of the line object cannot be less than 10 meters, and the area of the surface object cannot be less than 100 square meters. If there is a Geometry that does not meet the standard, the following operations can be carried out:
- In view of the uneven data quality, please merge the line and Region Dataset first, and perform Polygon Merge on the Region Dataset;
- Layer Browse Associated Table, and Ascending the SmLength or SmArea field to check whether there is an object that should exist but the length or area is too small;
- Modify the blend tolerance and the broken polygon tolerance until there are no objects with too small length or area.
- Use the DatasetContext Menu to browse the attribute data, Ascending the SmLength or SmArea field, and deleting objects with too small length or area.
- Layer Bounds Error One of the main reasons for the
- Reduce data complexity One of the manifestations of
data complexity is that there are too many nodes and too many sub-objects. If there are too many Data Nodes, Line Dataset can directly resample, and Region Dataset recommends that the topology be switched to the line first and then resample the line. And Topology Surface Construction again. For the problem of too many sub-objects, it is recommended to decompose Geometry. Before decomposition, the objects in the layer should be checked to avoid decomposing Donut Polygon.
In addition, if the point objects in a single layer are displayed tightly, Point Pumping can also be used to pump the point data according to the specified pumping radius, so that the map can achieve the desired degree of point sparseness.
Raster Dataset:
- Image Pyramid Build a pyramid
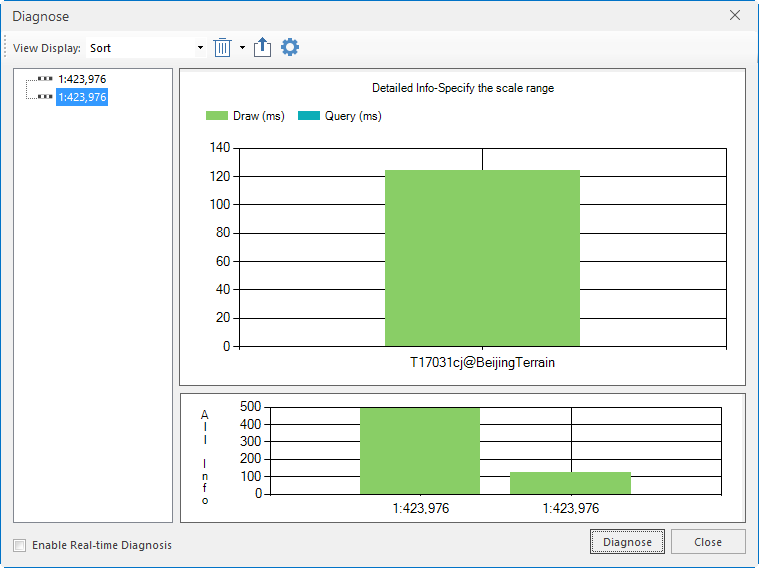
for the image, which can improve the browsing speed of the map. When you Add Image Data set in the map, the system will automatically ask for the Whether to create Image Pyramid. Select "Yes" to Image DatasetCreate Image Pyramid, and then display it in the Add to Map. For example, one refresh of a Image Data Create Image Pyramid takes approximately After Create Image Pyramid, the image Refresh Map takes about 72 ms at the same scale and view, which greatly improves the display performance of the map.
Optimize the map display
The relevant settings of Object Count and Display Effects displayed in the map also have a great impact on the drawing time. The specific optimization scheme is as follows:
- Layer Scale The detailed level of the content of the
map is different at different scales, so each layer in the map does not need to be displayed at all scales, so it is necessary to control the minimum Display Scale and the maximum Display Scale of the layer. Thereby ensuring that a minimum of content displayed within a certain scale is maintained. This can effectively improve the efficiency of map browsing and operation.
As shown in the figure below, with the enlargement of the three scales of Sichuan Digital Map, the layer content displayed in the small scale is meaningless in the large scale. Conversely, layer content displayed at a large scale does not need to be displayed at a small scale. Therefore, it is necessary to reasonably arrange the display contents at different scale levels according to the specific map requirements. In the Layer Properties dialog box, the Minimum Visible Scale "and Maximum Visible Scale" lets you set the conditions for the layer to be displayed and hidden. When the map scale is smaller than set Minimum Visible Scale "or larger than set Maximum Visible Scale", the layer is not visible.
- Layer Properties
- Set Object Display Order
For single-value and Graudated Colors Map in File Database, if the sub-item in the thematic map is Symbol Filling and the thematic expression consists of a field, Set this Field Settings in Layer Properties as the Object Display Order Field for the theme layer. This method can improve the drawing efficiency to a certain extent, and the improvement is more obvious and important under the massive map data.
- Object Minimum Display Size
When Map Scale is small, some small objects in the layer are almost invisible under the current scale, and the display is of little significance, so you can set a display condition through the "Minimum Object Display Size" in the "Layer Properties" Settings "dialog box. Objects smaller than given value are not visible, which can improve the efficiency of Refresh Map to some extent.
- Thematic Label MapLayer Settings The Thematic Label Map layer in the
map has the greatest impact on the map performance, and some Property Settings of the Thematic Label Map layer need to be treated with caution. For example, it is recommended not to check Flow Display in the process of drawing, and it is recommended to turn off No Overlap when the amount of data is large, because No Overlap is calculated in real time.
- Optimize Cross
Generally, in road mapping, the drawing order of road sections crossing roads on the map is determined by the vectorization order of road sections by default, so as to produce the result of road stacking. At this time, it will give people a kind of overlapping relationship between the two roads, which is actually an interchange between the upper and lower layers, but in fact, the overlapping roads are intersections or T-junctions at the intersection.
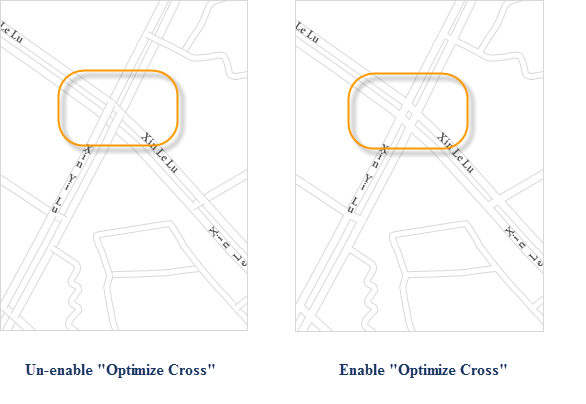
Turning on Optimize Cross will also reduce the performance of the map. If allowed, you can choose another mapping method to achieve the effect of Optimize Cross. After the Optimize Cross function is turned on, the drawing performance of the layer will be reduced. An alternative is provided here: the unreasonable linetype effect of the road intersection occurs because the linetype symbol used is formed by the overlay of two different styles of lines, as shown in the following figure. The same road data is added to the ground window twice, two layers are made, the two road layers adopt the line type symbol of a common single line, the color of the road on the upper layer is set as the Fill Color of the road, which is set as white here, and an appropriate line width is set; The color of the lower road is the color of the sideline, which is set to gray here. The line width is set to be greater than line width of the previous road layer, thus simulating a line symbol formed by the overlay of two lines with different styles and widths. In this way, the rendering of road intersections is the same as that of Optimize Cross, but the performance is slightly higher than that of layers with Optimize Cross turned on.

- Set Object Display Order
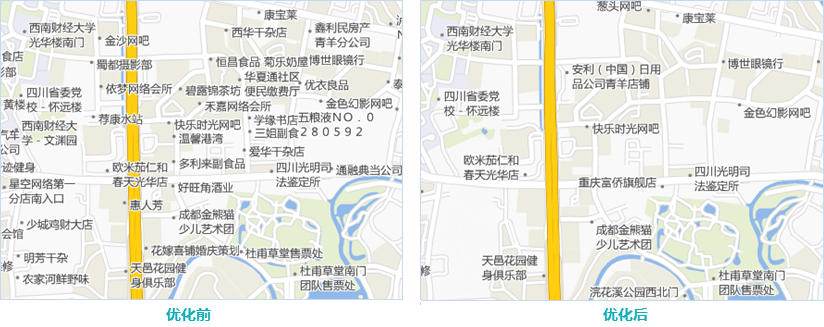
- Avoidance The point data with large
data and labels will be more dense when displayed in the map with small scale. Usually, we can achieve the target effect through the capping and avoidance settings of the Thematic Label Map. First, open the Properties Panel of the Thematic Label Map corresponding to the point data, check "No Overlap" "in the" Properties "panel, and set the" Cache Bounds "of text avoidance" as the appropriate Distance Data in the "Advanced" tab. At the same time, you must check the "Show/" Hide Points with Text "in the" Overlap Settings "list" in the "Map Properties" Settings "dialog box. After the setting is completed, the map label can be displayed reasonably.
- Map Properties Some Property Settings of the
map have a greater impact on performance. Therefore, in practical applications, it is necessary to consider whether to use alternatives to achieve the effects of the following Map Properties settings: Dynamic Projection, Line Antialiasing, Text Antialiasing, and Overlap Settings. SuperMap The software also provides anti-aliasing and Overlap Settings in the layer level. You do not need to turn on the anti-aliasing and Overlap Settings of the entire map. You can only turn on the anti-aliasing or capping of individual Layer Settings. Enabling Dynamic Projection will also affect the map performance. It is recommended to uniformly convert the data to be added to the same map into a consistent projection, so as to avoid affecting the refresh efficiency of the map due to enabling Dynamic Projection.
Executive summary
 Query time consuming optimization
 Time consuming optimization of data acquisition


