


Feature Description
Point thinning refers to the process where, based on a specified thinning radius, all points within a circle centered on a point in the dataset are thinned, and a single point is used to represent all points. The resulting point may not be the centroid of the thinned point set and has a certain randomness.
Application Scenarios
It can be used for mapping at small scales. If the points in the point data are dense, overlapping may occur when displayed at small scales. By thinning the point objects with this function, the overall information of the point data can be preserved while improving map performance and display effects.
Function Entry
- Data tab -> Data Processing -> Vector -> Point Thinning.
- Toolbox -> Data Processing -> Vector -> Point Thinning.
Parameter description
- Source Dataset: Used to display and set the point dataset to be thinned and its data source.
- Thinning Radius: Used to set the radius for thinning points, indicating that only one point is randomly retained within the circle of this radius. A larger radius results in sparser point objects in the result dataset.
- Statistics Type: For the original field values of the result points retained within the thinning radius, a certain statistics type is selected to update. A new statistic field is added to the result dataset, and the calculated result is assigned to this field. The supported statistics types are eight: Average, Maximum, Minimum, Sample Standard Deviation, Sample Variance, Standard Deviation, Variance, and Sum.
- Average: When the statistics type is Average, the value of the statistic field is the average of the property field values of all points within the thinning radius.
- Max: When the statistics type is Max, the value of the statistic field is the maximum of the property field values of all points within the thinning radius.
- Min: When the statistics type is Min, the value of the statistic field is the minimum of the property field values of all points within the thinning radius.
- Sample Standard Deviation: When the statistics type is Sample Standard Deviation, the value of the statistic field is the sample standard deviation of the property field values of all points within the thinning radius.
- Sample Variance: When the statistics type is Sample Variance, the value of the statistic field is the sample variance of the property field values of all points within the thinning radius.
- STDEV: When the statistics type is STDEV, the value of the statistic field is the standard deviation of the property field values of all points within the thinning radius.
- Sum: When the statistics type is Sum, the value of the statistic field is the sum of the property field values of all points within the thinning radius.
- Variance: When the statistics type is Variance, the value of the statistic field is the variance of the property field values of all points within the thinning radius.
- Randomly Save Rare Points: If checked, a point is randomly selected and saved from within the thinning radius; otherwise, the point with the smallest sum of distances within the thinning radius is selected.
- Keep Source Field: If checked, the property fields in the source data will be retained.
- Statistic Field: In the statistic field list box, the property fields of integer type in the thinned point dataset are displayed. You can select and set the property value fields of the point dataset participating in thinning, as well as the property fields and statistics types of the result dataset after thinning.
- Result Data: Used to display and set the result dataset and the data source where it will be saved.
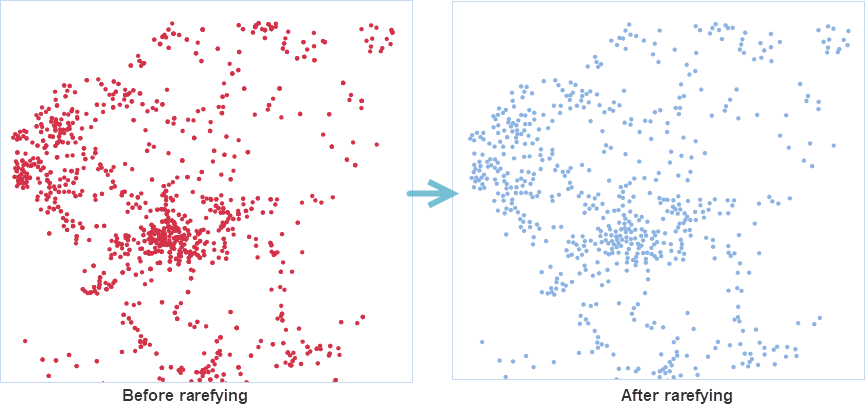
After setting the above parameters, click the Run button to thin the specified point dataset. Upon successful execution, the output window will display a "the execution completed" message. The resulting rarefied points are shown in the figure below. The left image is a heat map generated from the point dataset before thinning, showing overlapping in dense areas with poor rendering effects. The right image is a heat map generated from the thinned point dataset, which has sparser point objects, no overlapping, and better rendering effects.
Related Topics