Drawing Tables
Instructions for use
In practical applications, creating thematic maps can visually display some statistics information on the map. However, for more complex data statistics, presenting them in tables is clearer. Therefore, inserting tables in the layout effectively compensates for the shortcomings of thematic maps, making published maps more professional and informative.
Additionally, when external tables change, simply refresh the table content directly in the layout.
Application Scenarios
- Inserting timetables in schematic maps: In schematic maps of universities, it is often necessary to display bus schedules, which are typically recorded in external Excel files, posing challenges in creation and updates. Therefore, by using the table insertion feature in the layout, you can directly connect to external Excel files, quickly create maps with tables, and promptly update table content.
Function Entry
- layout->features->objects->Table button.
Operation Steps
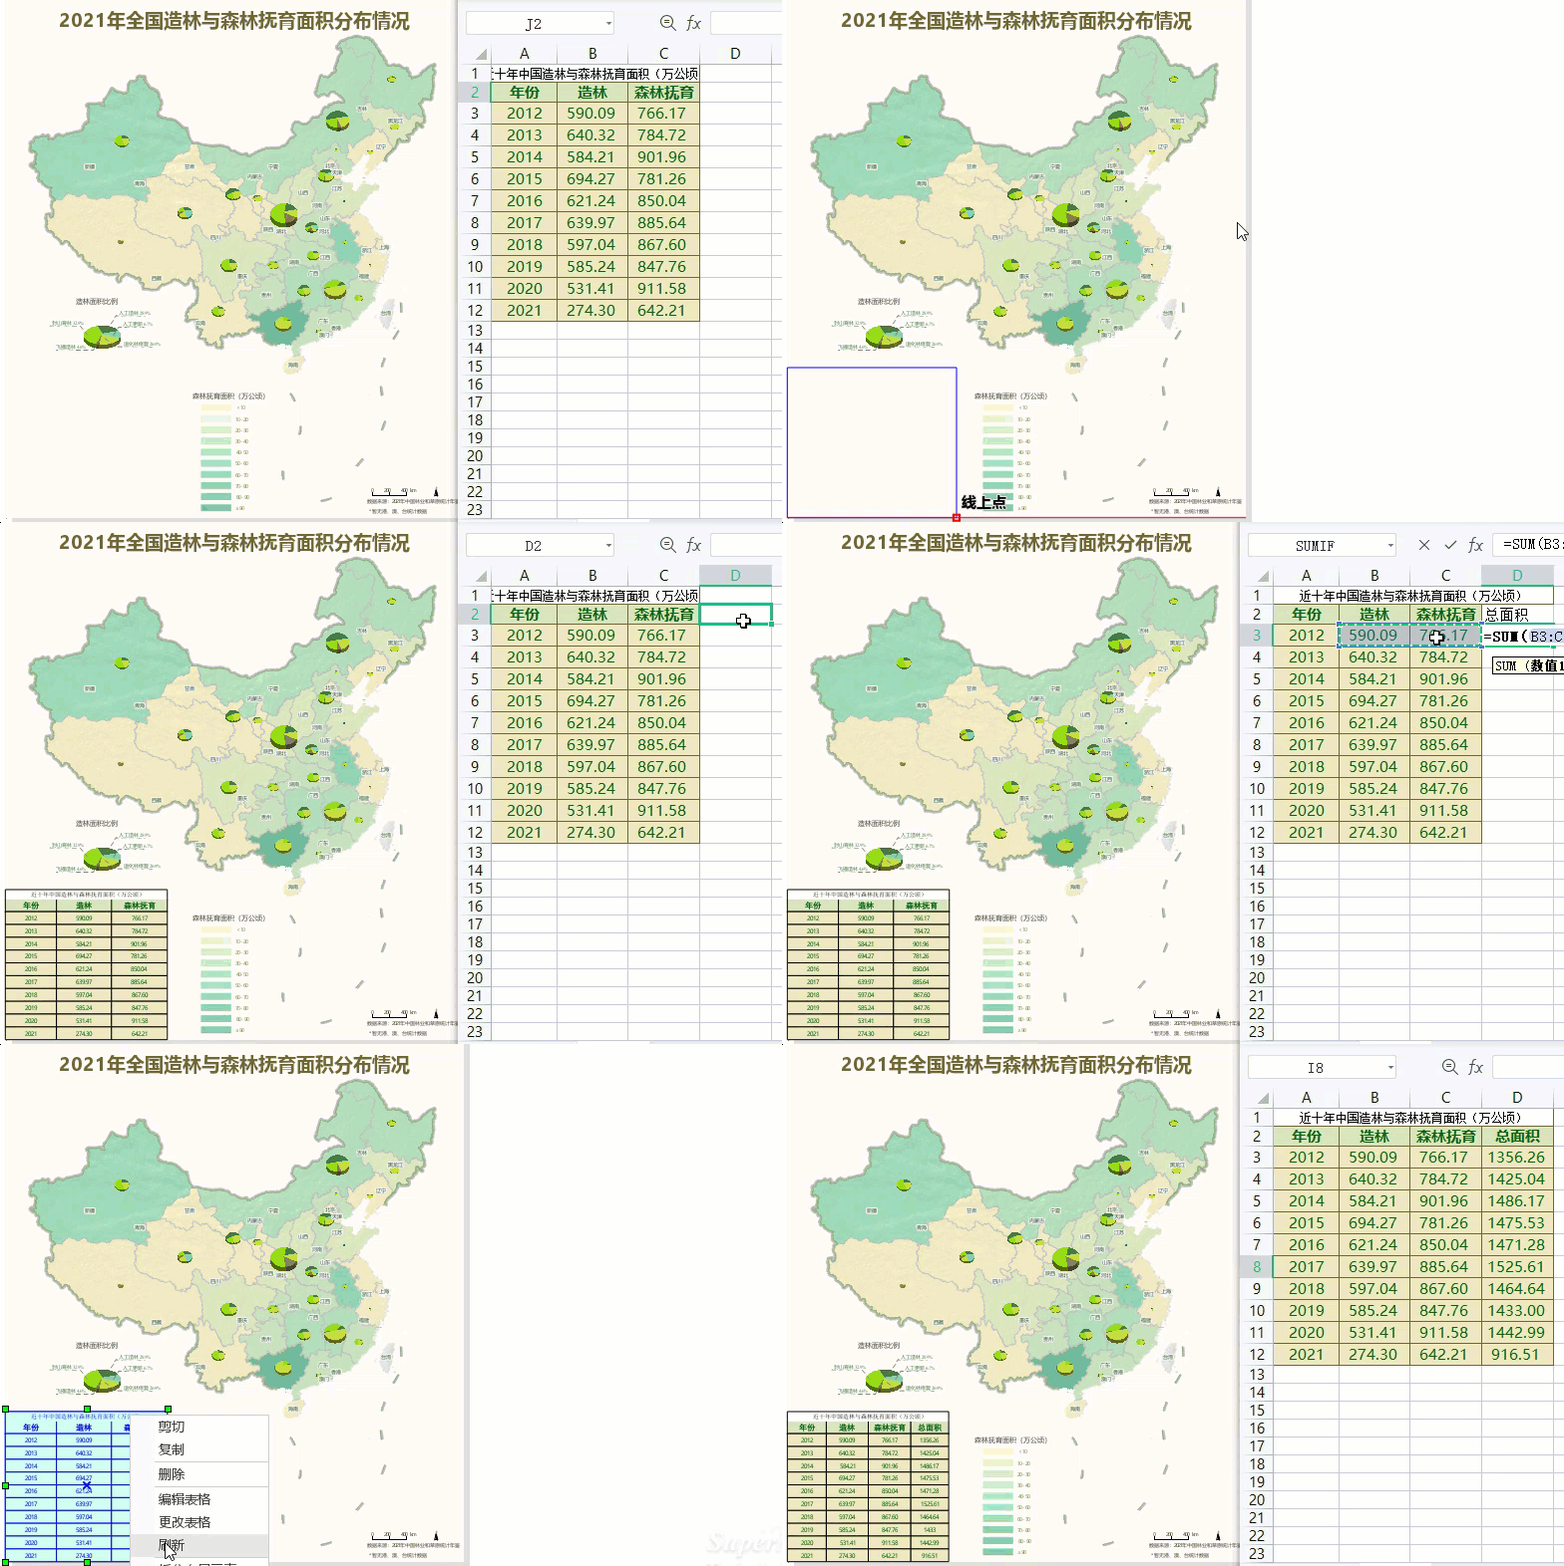
- In the layout, draw the insertion area for the table.
- In the pop-up Select a table dialog box, select the table to import, supporting *.xlsx and *.xls formats.
- After selecting the table, check the Keep original table size checkbox below to add the table to the layout at its original size. If unchecked, the table scales to the drawn size for display in the layout.
- Edit Table: After selecting the table, choose Edit Table in its context menu. The program automatically opens the corresponding Excel file. After modifying and saving the content, select the refresh function in the table's context menu in the layout to update it.
- Adjust table position and size: After selecting the table, move its position and adjust height and width in the layout. Alternatively, double-click the table object, and in the left-side Layout object properties panel, use the Geo tab to set the table's size and position.

Related Topics


