


Optimizing mosaic datasets includes the following:
6. Dataset Check and Optimization
Create Image Pyramids
Feature Description
Creating image pyramids for a mosaic dataset aims to improve the display efficiency of large volumes of image data. The program constructs multiple layers of pyramids from the original images according to certain rules, displaying pyramid images of corresponding resolutions at different scales. When building overviews for a mosaic dataset, all images within the mosaic dataset must have pyramids to enhance data browsing speed.
Feature Entry
- Workspace Manager -> Right-click menu of the mosaic dataset in the datasource list -> Optimize Mosaic Dataset -> Create Image Pyramids -> Create Image Pyramids dialog box.
-
Toolbox -> Image Management -> Optimize Mosaic Dataset -> Create Image Pyramids.
Parameter Description
Set parameters for creating image pyramids, including resampling methods and compression methods.
- Resampling Method: The program provides the following resampling methods:
- Nearest: Assigns the value of the nearest cell in the input raster dataset to the corresponding cell in the output raster dataset.
- Average: Calculates the mean of all valid values for resampling.
- Gaussian Kernel: Uses a Gaussian kernel for resampling, which is effective for images with high contrast and distinct pattern boundaries.
- Average Complex Data: Averages data in a magphase space, used for resampling images in complex data spaces.
- Bilinearity: Assigns the weighted average of the four nearest cell values in the input raster dataset to the corresponding cell in the output raster dataset. This method produces smoother results than the nearest neighbor method but may alter the original raster values.
- Cubic Convolution: Similar to bilinear interpolation, assigns the weighted average of the sixteen nearest cell values in the input raster dataset to the corresponding cell in the output raster dataset. This method produces the sharpest results, with edge enhancement effects, but is computationally intensive and time-consuming.
- Cubic Linearity: Based on the Akima interpolation algorithm, which requires the use of two measured points and the four neighboring measured points for interpolation. In total, six cell values are considered for resampling. This algorithm accounts for the effect of derivative values, resulting in a smooth and natural interpolation curve without unnatural oscillations.
- Lanczos Sine Resampling: Utilizes a convolution filter, moving the origin of the convolution function to each resampling center, then multiplying and summing all input values with the convolution function values at that position. The convolution function, also known as the Lanczos kernel, is based on the sinc(x) = sin(x*pi)/x function.
- Compression methods: The program offers DEFLATE, JPEG, and LZW encoding methods. You can choose based on actual application needs to balance the display quality of the pyramid and storage space usage. You can also select NONE to avoid compressing the image. For specific descriptions, please refer to Grid Encode Type.
- Force Build Image Pyramid: If selected, the program will forcefully recreate and overwrite existing image pyramids if they already exist.
Delete Image Pyramids
When importing large volumes of image data, image pyramids are typically created. After editing the image dataset, the previously created image pyramids remain unchanged. In this case, you need to delete the previous image pyramids and recreate them.
Feature Entry
- Workspace Manager -> Right-click menu of the mosaic dataset in the datasource list -> Optimize Mosaic Dataset -> Delete Image Pyramid.
-
Toolbox -> Modify Mosaic Dataset -> Delete Image Pyramid.
Create Histogram
Feature Description
Creating histograms for a mosaic dataset reflects the data characteristics and determines the dataset's stretch display effect. Histograms are created for all files within the mosaic dataset. If some images contain histograms and others do not, a prompt dialog box will appear: "Some images already have histograms. Do you want to recreate them?" Choosing "Yes" will create histograms for all images, overwriting existing content; choosing "No" will create histograms only for images without them.
No entry is provided for viewing histograms.
Feature Entry
- Workspace Manager -> Right-click menu of the mosaic dataset in the datasource list -> Optimize Mosaic Dataset -> Create Histogram.
Rebuild Spatial Index
Feature Description
In the Spatial Index Management dialog box, you can view, create, and modify the spatial index of the dataset. For detailed information, refer to Rebuild Spatial Index.
Feature Entry
- Workspace Manager -> Right-click menu of the mosaic dataset in the datasource list -> Optimize Mosaic Dataset -> Rebuild Spatial Index.
Build Overview
Feature Description
To improve the display efficiency of a mosaic dataset, data by default only displays mosaic outlines at small scales, not the original images.
Feature Entry
- Workspace Manager -> Right-click menu of the mosaic dataset in the datasource list -> Optimize Mosaic Dataset -> Build Overview -> Build Overview dialog box.
Parameter Description
Set the maximum width, maximum height, sampling factor, and output path for the overview.
- Maximum Width and Height: The maximum width and height of the overview image file.
-
Sampling Factor: The resolution ratio between adjacent overview levels.
- Output Path: The storage path of the overview image file.
- Remove No-Value Overlay: To avoid no-value areas at image seams overlapping valid areas and to prevent abnormal display effects of overview images, starting from SuperMap iDesktopX 11i(2024), before building overviews, you need to set and enable no-value in the mosaic dataset properties panel (check "Replace Missing No-Value" and click the "Apply" button). The effect after enabling is shown below:
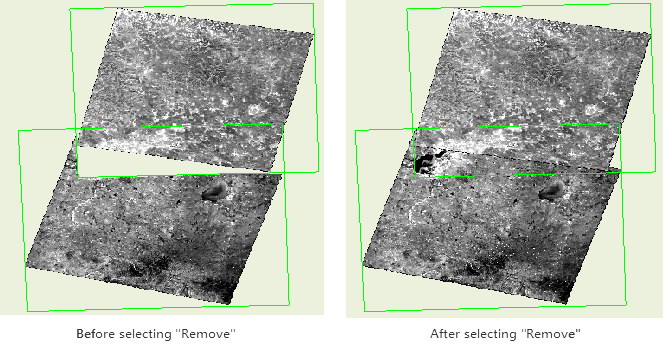 |
| Figure: Comparison of No-Value Overlay Settings |
Building overviews for a mosaic dataset reconstructs multiple layers of pyramids from the original images according to certain rules for display at small scales. After building overviews, image files are generated in the overview output path, and related records are added to the properties of the footprint sub-dataset, including the filename and path of the overview image file, resolution information, and more.
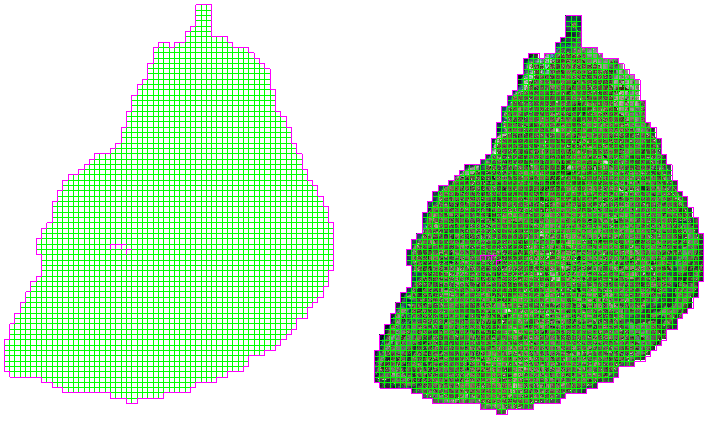 |
| Figure: Added Overview Records in Footprint Properties Table |
 Caution:
 - When encountering an issue where, after creating overviews for a mosaic dataset, the overviews are not visible when zooming to a very small scale, it is due to the display of the mosaic dataset's overviews being controlled by the SmMinPS/SmMaxPS field values. When the display resolution of the raster exceeds the SmMaxPS value, the mosaic dataset will not display.
- If your data covers a large area with many stitched images and you need to view the data at very small scales, you can modify the SmMinPS and SmMaxPS field values in the footprint properties table so that the SmMaxPS value is still greater than the raster display resolution at small scales.
Dataset Check and Optimization
Feature Description
Quickly inspect and optimize the data status of a mosaic dataset, such as whether it is block-stored, whether image pyramids are created, and whether compression methods are set.
Feature Entry
- Workspace Manager -> Right-click menu of the mosaic dataset in the datasource list -> Optimize Mosaic Dataset -> Check and Optimize Data -> Check and Optimize Data dialog box.
Parameter Description
- Block Storage and Compress: Checking this box allows for optimization of block storage and compression types. Converting image data to block storage can improve the speed of loading and browsing image data, thereby enhancing the data processing efficiency of the mosaic dataset.
- Image storage methods are divided into three types: scanline storage, strip storage, and block storage. Depending on the storage method, the reading method also differs:
- Reading by scanline: the system reads one line at a time;
- Reading by strip: the system reads N lines at a time based on the specified strip width N;
- Reading by block storage: the system reads N blocks of data at a time based on the specified number of blocks N.
For example, to read a 2560×2560 image:
- Using the scanline method will read 2560 times, with each read size being 1×2560;
- Using the strip method, the number of reads will be 2560/N, with each read size being 2560×N. The larger the N, the more memory is relatively occupied, which can have a certain impact on the reading speed.
- Using the block storage method, the image is divided into 100 blocks of 256×256. The system needs to read at most 100 times, with each read size being 256×256, shortening the display time and improving reading efficiency. Compared to the first two methods, block storage is the optimal storage method.
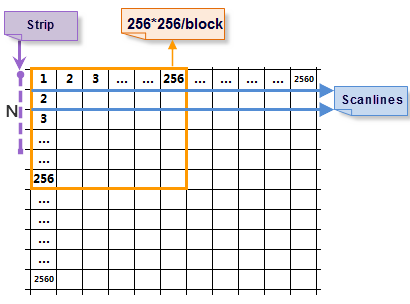
Image: 2560×2560 Image - Compression Type: The program provides three encoding methods: DEFLATE, JPEG, and LZW, which can be selected according to actual application needs.
-
Image Pyramid: Checking this box allows for the creation of image pyramids for the data.
- Resampling Method: After checking the Image Pyramid box, you can select the resampling method. For specific descriptions, please refer to Raster Resampling Introduction.
- Use GDAL: Checking this box allows for optimization using GDAL.
- Process Count: Supports setting multiple processes to execute optimization. The number of processes needs to be set according to the machine's configuration and process usage. The default is the number of available processes at runtime divided by 2.
Related Topics