


Feature Description
Analyze the spatial distribution patterns and trends of sample data to determine the presence of spatial autocorrelation (available through spatial statistics). Then estimate total population parameters or means based on sample data, such as regional population count, population density, climate change, pollution levels, disease prevalence, etc. Provides six statistical inference methods corresponding to the models under Random Sampling, including: simple random sampling, system random sampling, spatial simple random sampling, stratum random sampling, spatial stratification random sampling, and sandwich random sampling.
Feature Entry
- Spatial Statistics Tab -> Spatial Sampling and Statistical Inference -> Statistical Inference.
- Toolbox -> Spatial Statistics > Spatial Sampling and Statistical Inference -> Statistical Inference.
Parameter Description
Random Sampling Type: Includes six methods: simple random sampling, system random sampling, spatial simple random sampling, stratum random sampling, spatial stratification random sampling, and sandwich random sampling. Select the appropriate sampling model for statistical inference based on data characteristics.
Sampling Data Field: Specified sampling data field.
Confidence Level: Based on the normal distribution assumption of means, indicates the degree of confidence in the results. Refer to explanations in Basic Vocabulary of Spatial Statistics.
Sample Layer ID: Specified stratification ID for samples (system automatically generatedLayered_ID). (Required for Stratum Random Sampling, Spatial Stratification Random Sampling, and Sandwich Random Sampling)
Total Population Size: Specified total population sample size in stratified objects (system automatically generatedLayered_PopulationSize). (Required for Stratum Random Sampling, Spatial Stratification Random Sampling, and Sandwich Random Sampling)
- Source Dataset: Set the dataset and its datasource for statistical inference.
- Stratum Data: Configure the stratum dataset and its datasource for sandwich random sampling. Stratum data refers to hierarchical divisions of the study area based on expert knowledge, historical data, and auxiliary information, aiming to minimize intra-layer variance and maximize inter-layer variance (significant spatial differentiation). Layers can be divided in either geographic or attribute space (i.e., categories), and contiguous areas are not required within the same layer. (Required only for Sandwich Random Sampling)
- Reporting Unit Data: Configure the reporting unit dataset and its datasource for sandwich random sampling. Reporting units are the top-level units in the "sandwich" model, which can be administrative units, natural units, grid cells, or any other user-defined spatial units. Final results provide estimates for each reporting unit. (Required only for Sandwich Random Sampling)
- Parameters: Configure according to different random sampling types.
Application Case
To estimate the total population of Heshun County, Shanxi Province in 1998, township administrative divisions were used as strata to sample 326 administrative villages. The requirement was to ensure the standard deviation of total population estimation did not exceed 12,626 (i.e., the mean variance of estimated total population in software should be below 1,500). The number of villages per township was known, and population standard deviations per stratum were estimated from historical survey data.
Based on the case in stratum random sampling, sample points were obtained with manual total population input. Using the Statistical Inference function, the mean total population of Heshun County in 1998 was inferred. Details:
- Case Data: Click to download case data for stratum random sampling and prediction inference (requires extraction after download).
- hs_samplingframe: Administrative village point dataset;
- hs_town: Township administrative data as stratum data. Attributes: CODE (township ID), NAME (township name), NUM (number of villages), STDEV (historical population standard deviation);
- RandomSamplingResult: Village sample data with Value field showing 1998 population counts;
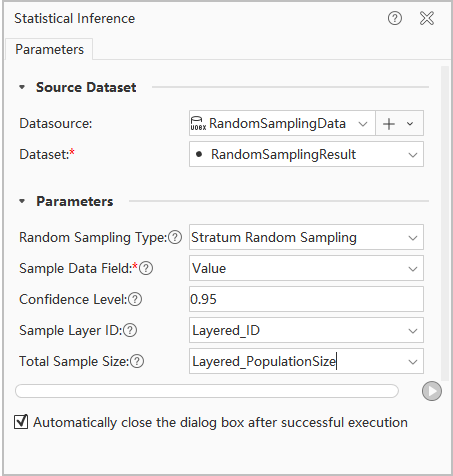
- Parameters: After opening RandomSamplingData.udbx in desktop software, configure the Statistical Inference dialog as shown below. Set source data, sampling type, sampling data, sample layer ID, and total sample size, then click Execute to perform statistical inference.
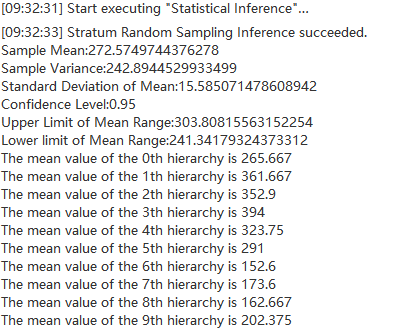
- Result Interpretation: Based on 55 village samples, the inferred mean total population is 272.57. Other parameters include standard deviation (242.89) and stratum-specific means. The standard variance meets the case requirement (<1,500). Results in output window: