


Regression analysis models, examines, and explores spatial relationships to explain causal relationships between dependent and independent variables. It helps identify key factors influencing modeled variables and predict unknown values. Reasons for using regression analysis include:
- Identify causes: Model phenomena to better understand contributing factors and assess the impact of explanatory variables. For example: Analyze environmental characteristics (temperature, humidity, food sources, hunting pressure, predators) affecting endangered species to inform conservation strategies.
- Prediction: Predict dependent variable values based on known relationships between variables. For example: Forecast fiscal revenue using historical data on industrial output, retail sales, exports, and fixed asset investments.
- Data mining: Verify positive/negative correlations between phenomena. For example: Investigate whether burglary rates correlate with neighborhood wealth levels.
Applications of Regression Analysis
It addresses questions like: Why does a phenomenon persist? What factors drive its occurrence? How to model phenomena for predictions across locations or time periods?
This method is widely used to interpret market share, sales, brand preference, and marketing effectiveness. It quantifies relationships between interval/ratio variables through functional forms. Application examples include:
- Model high school retention rates to identify factors keeping students in education.
- Establish functional relationships between traffic accidents and variables like speed, road conditions, and weather to inform police strategies.
- Model property fire loss against variables like fire department response time and intervention levels. Key factors may indicate needs for additional fire stations or equipment.
Analytical Principles
A regression equation mathematically predicts dependent variables (y) using explanatory variables (X). Each independent variable has a regression coefficient (β) indicating relationship strength and direction. The general form is:
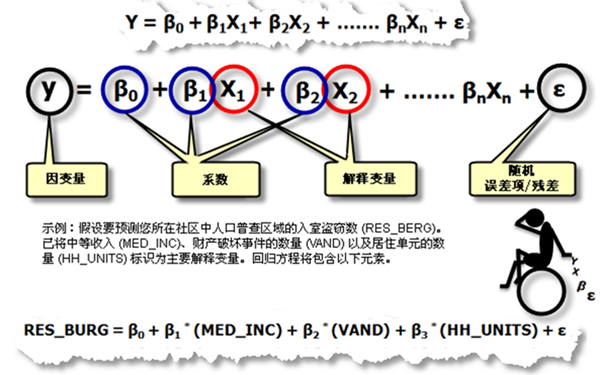
- Dependent variable (y): The observed value being predicted (e.g., housing prices, burglary counts). Located on the equation's left side.
- Explanatory variables (X): Independent variables on the equation's right side used for modeling. For example: Predict annual store revenue using customer numbers, competitor proximity, and local consumption patterns.
- Regression coefficients (β): Numeric values showing each X variable's relationship with y. Positive coefficients indicate positive correlations, negative values show inverse relationships. Magnitude reflects relationship strength.
Geographically Weighted Regression (GWR) calculates attenuation functions based on spatial coordinates. The spatial weight matrix W(ui,vi) in the attenuation function generates location-specific β values for regression equations.

Ordinary Least Squares (OLS)
OLS is the simplest global regression method, producing equations with optimal statistical properties (linearity, unbiasedness, efficiency). It provides diagnostic parameters for model validation. Geographically Weighted Regression (GWR), a local spatial regression method, fits separate equations to each feature using neighboring data within specified bandwidths. Properly applied, both methods deliver robust statistical insights into linear relationships.
Both OLS and GWR represent linear relationships where variables change proportionally. For example: Positive correlation between trash bin density and neighborhood cleanliness.
Analysts should start with OLS to establish baseline models before applying GWR with the same variables. For instance: First predict housing prices using OLS to identify key factors, then refine predictions with GWR.
Geographically Weighted Regression
GWR constructs local models by fitting regression equations to each feature, accounting for spatial non-stationarity in relationships. Bandwidth parameters (kernel type, distance, neighbor count) determine spatial influence ranges. This method addresses spatial variability in variable interactions caused by geographic location changes.
Related Topics
Geographically Weighted Regression (GWR)
Measuring Geographic Distributions