


Instructions for use
Chart Symbology is one of the important functions of SuperMap Chart Browsing. By setting Nautical Chart Properties parameters, you can control the symbolic style, color mode, symbol and Boundary Type of the chart. O as to realize more accurate chart Display Effects suitable for different scenes. This setting helps improve chart readability and navigation accuracy.
Operation steps
- Load the Chart Group to be browsed into the Map.
- Select Chart tab-> Nautical Chart Properties group-> click Nautical Chart Properties button. The Nautical Chart Properties panel pops up on the right, and the Show Settings group is expanded.
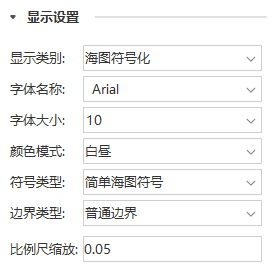
- The Show Settings group contains the following options:
- Display Category: In different application scenarios, select the appropriate Display Method to make the Chart Data display more in line with the requirements.
- Chart Symbology: Display the chart according to the S-52 Electronic Chart display specification to ensure that the symbols conform to the industry standard.
- NONE: The map data is displayed in the form of ordinary points, lines and planes, and is not symbolized.
- Font: Select the font style to be used for display. The default is Arial font.
- Font Size: font size can be selected or customized.
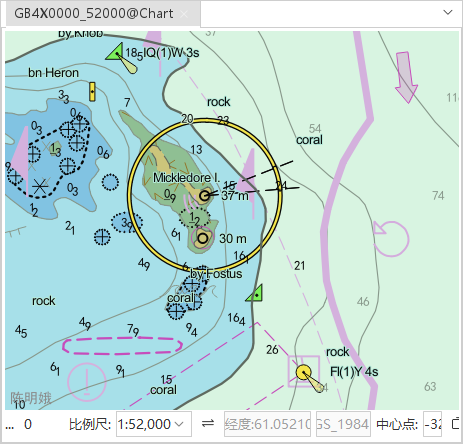
- Color Mode: Switch the color mode to improve the detail resolution of the chart according to the ambient light conditions to ensure safe navigation.
- Daytime: Default mode, suitable for daytime lighting conditions, providing better visual effects.
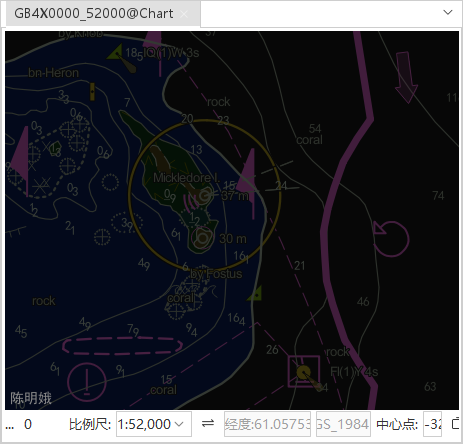
- Dawn and dusk: Adapt to the light conditions of dawn and dusk, and relieve visual fatigue.
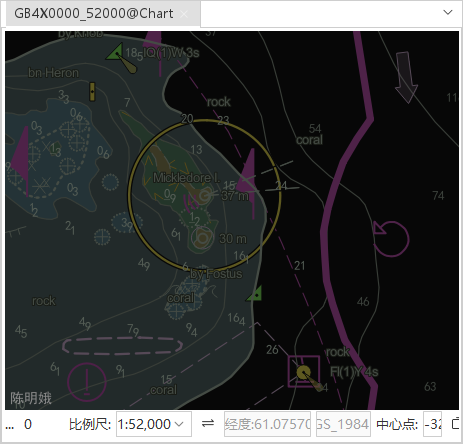
- Night mode: Optimize the visual experience in the night light environment.
|
|
|
| Display Effects in Daytime Mode |
Display Effects in twilight mode |
Display Effects in Night Mode |
- Symbol Type: Provide different Symbol Types to meet different needs and usage habits.
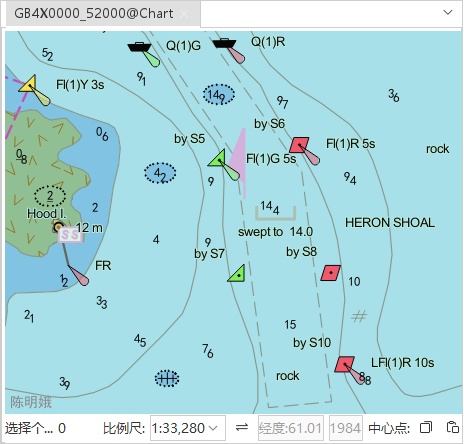
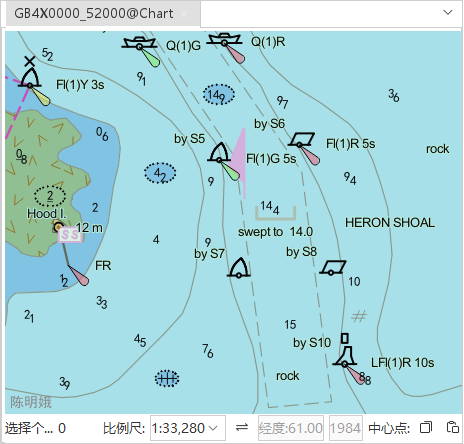
- Simplified Marker: Display the point symbol in a simple form, which is concise and clear.
- Traditional Marker: The point symbol is displayed in the traditional way, which conforms to the navigation standard.
|
|
| Display Effects for Simplified Marker |
Traditional Marker's Display Effects |
- Boundary Type: The setting of Boundary Type affects the accuracy and beauty of the area display, and is applicable to different usage scenarios.
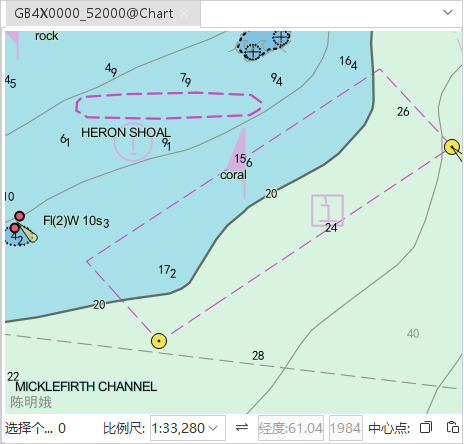
- Normal Boundary: Displays the area boundary in a normal style.
- Boundary Symbology: Displays the boundary of the area in a symbolic form, which is more intuitive.
 |
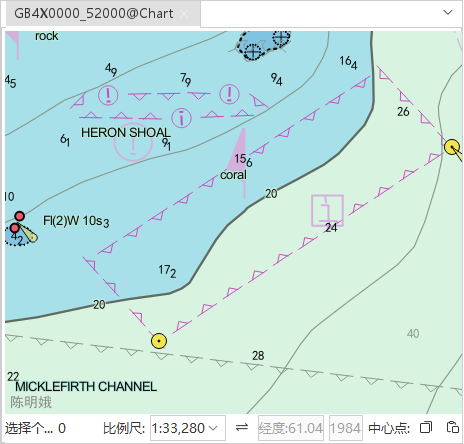 |
| Display Effects for Normal Boundary | Display Effects for Boundary Symbology |
Scale:
-
Edit Scale: In the grouping attribute of Chart Data set, the edit scale bar indicates the Minimum scale of Chart Group displayed in Map. You can view the Edit Scale information in the Properties panel popped up on the right by right-clicking Chart Group in the Workspace Manager and selecting Properties.
-
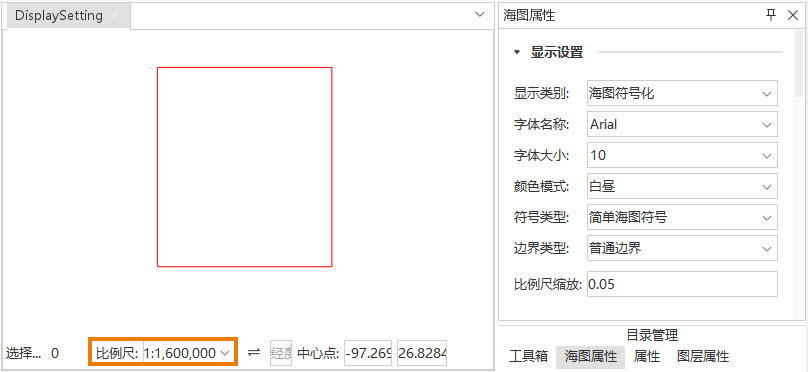
Scaling of scale bar: indicates the multiple by which the original scale bar is scaled when it is displayed. For example, the original editing scale of a Chart Group is 1: 80,000, and the default zoom factor is 0.05. After zooming, the scale becomes 1: 1,600,000. The contents of the chart will be displayed only when the scale of the Map is larger than scaled scale, as shown in the following figure.
-
 |
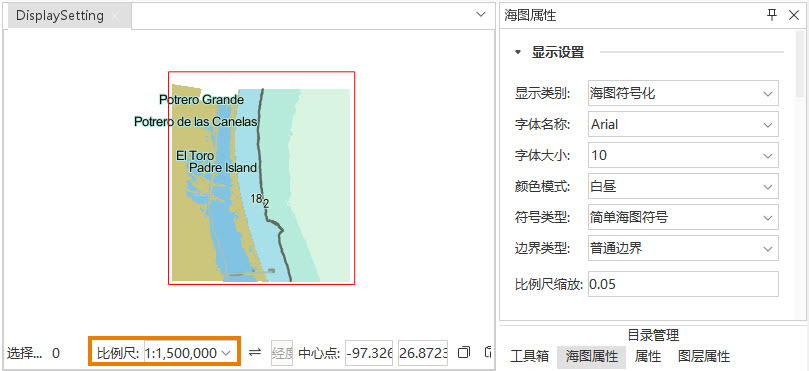 |
| Display Effects that are larger than scaled bar when displayed | Is no more than Display Effects of the scaled bar when displayed |
 Hint:
Hint: Bounds Settings: 0-1 (to 22 decimal places). If set to 0, the chart can be displayed at any scale. If set to 1, the chart will be displayed at the original editing scale.
Related topics