


Chart loading and display
Instructions for use
Loading a chart into a Map is the basic operation of Chart Browsing. SuperMap provides two ways to load charts:
- Open the chart in a new Map
- Add to Current Map Window
Load Chart to Map
Method 1: Add the chart to the new map
- Select the Chart Group you want to browse in Workspace Manager. You can use the shift or ctrl key to select multiple Chart Groups at the same time.
- Right click the selected Chart Group, and select the Add to New Map button in the pop-up Context Menu. This creates a new Map in which the entire chart is displayed.
- For a single Chart Group, it can be opened and displayed directly by double-clicking.
Method 2: Add the chart to Current Map
- Select the chart Dataset Group you want to browse. You can use the shift or ctrl key to select multiple groups.
- Right-click Chart Group in Workspace Manager and select the Add to Current Map button in the pop-up Context Menu. This function allows multiple charts to be displayed additionally in the same Map.
- For additional display of multiple charts, please refer to the integrated display of sea and land for details.
Display Control
You can adjust the Display Effects of a Chart Layer loaded into a Map through the underlying Display Control settings.
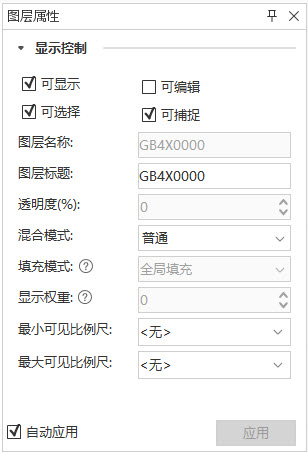
Set Layer Properties
- In the Layer Manager, click the layer whose properties you want to set. Select Layer Properties in the Context Menu, and the Layer Properties panel will pop up on the right side of the interface.
- Expand the Display Control group, where you can set the relevant display.
Visible Scale Settings
When a chart conforming to the S-100 standard is loaded into Map, if the chart is not displayed normally, it is usually due to the setting of the visible scale. The following is a description of the setup:
- Visible Scale for Chart Group:
- The S-101
- , S-127, and S-131-compliant Chart Group includes the DataCoverage Dataset. The maximumDisplayScale and minimumDisplayScale fields represent the maximum and Minimum Visible Scale, respectively, and control the visible range of the packet data. Currently, these fields do not support direct modification.
- When a Chart Group is loaded to a map, each group is displayed as a layer, and default maximum and Minimum Visible Scale values are displayed in the Display Control section of the Layer Properties. These values are derived from the above fields of the DataCoverage Dataset.
- Visible Scale of the layer:
- If the Chart Group is not displayed properly in the Map, check whether the current scale of the layer is within the default visible scale range:
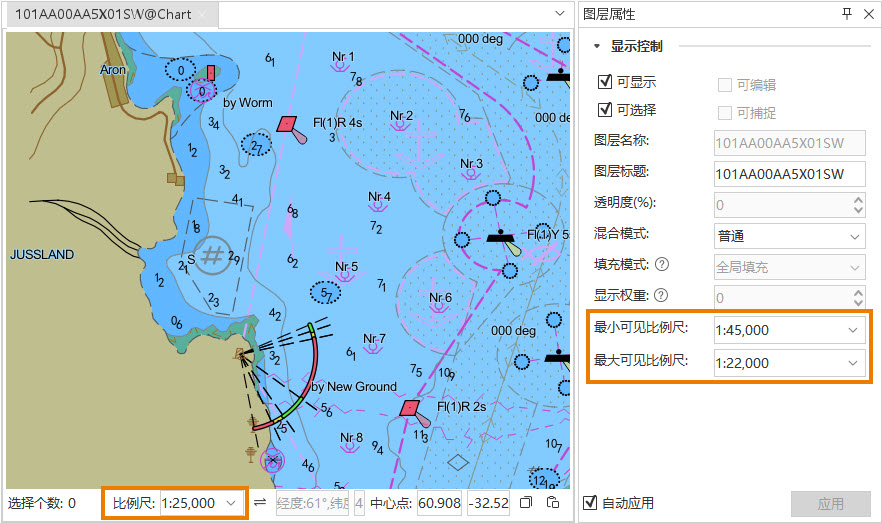
- View and adjust the visible scale bar
- in the Layer Properties panel. You can make the chart display properly by zooming Map to the appropriate scale range.
- Or directly modify the visible Scale Settings of the layer and save the changes to Workspace. It should be noted that this modification does not affect the original field configuration of the DataCoverage Dataset, but the next time you Open Map, the layers will be displayed according to your new settings.
- If the Chart Group is not displayed properly in the Map, check whether the current scale of the layer is within the default visible scale range:
Related topics