


Filter Settings
Instructions for use
In the Display Filter group of the Properties panel of the chart, various controls are provided to customize the Display Effects of the chart, including Display Type, meta object, bathymetric point, sheet number, etc. Set Filter can optimize Chart Browsing experience, reduce unnecessary information interference, quickly locate key content, and improve browsing and analysis efficiency.
Operation steps
- The Chart Group to be browsed is loaded into the Map.
- Select Chart tab-> Nautical Chart Properties group-> click Nautical Chart Properties button. The Nautical Chart Properties panel pops up on the right, expanding the Depth Settings group.
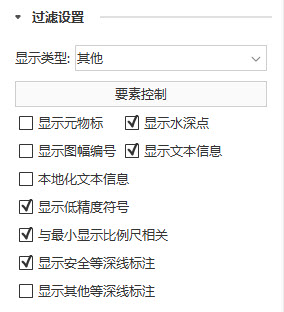
- The Show Settings group contains the following options:
- Display Type:
- Standard: The default chart display.
- Basic: Displays only basic content that cannot be deleted.
- Other: User-defined options content, such as water depth point, meta object, Text Info, etc.
- Element Settings: You can set the display and selection status of the object in Map. If Displayable is checked, the target is visible. If Selectable is checked, the target can be selected. For details, please refer to: Object Element Display Control .
- Check box options:
- Show MetaObject: control whether to show MetaObject, only available when Display Type is Other.
- Display Soundings: Control whether to display the Soundings value. Only available when Display Type is Other.
- Display Cell Number: Controls whether to Display Cell Number.
- Show Sheet Border: control whether to display the outer border of the current chart sheet.
- Local ization Display Text: It is used to control whether the Text Info of the object is displayed in the localization mode. It is only available when Display Text Message is checked.
- Display Text Message: Control whether to display the text message.
- Display Low Accurate Marker: It is used to control whether to display the symbol corresponding to the data with insufficient measurement accuracy. Usually, in chart survey data, the accuracy or reliability of data is expressed by QUAPOS field, and these data may be Display Low Accurate Marker. In the S-52 standard, such symbols are represented by LOWACC01.
- Associated with Minvisible Scale: It is used to control the display of the change of the object with the scale of the chart. When the Minimum Visible Scale of the object is greater than current scale, the object will not be displayed.
- Display Safety Contour Label: controls whether to Display Safety Contour Label.
- Display Other Contour Label: controls whether to Display Other Contour Label.
Related topics