


Instructions for use
For Extract Point set isoline, Interpolation Analysis shall be performed on the Point Dataset to obtain the Raster Dataset, and the adjacent points with the same elevation value in the Raster Dataset shall be connected. Extracts contours of points with equal elevation values.
The SuperMap desktop product currently supports isoline extraction from Point Dataset, a collection of 3D points. Point Dataset uses a field to store the Attributes used to extract the isoline, such as elevation, temperature, etc. In addition to the coordinate information of the point, the 3D point set also stores the third dimension information. The principle of isoline extraction from point data is to interpolate the Point Dataset and 3D point set to obtain the Raster Dataset, and then extract the isoline from the Raster Dataset.
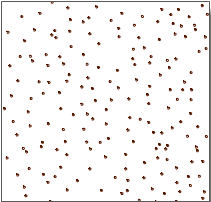
The scattered points in the point data can well represent Position Info, but other Attributes of the point itself can not be intuitively reflected. For example, the elevation information of a large number of sampling points in a study area has been obtained, as shown in the following figure. From the point data in the left figure, the trend of terrain fluctuation can not be seen. If the information contained in the data of these points is expressed in the form of isoline by using the principle of isoline, that is, the adjacent points with the same elevation value are connected to form the contour map shown in the right figure, the topographic information of this area can be clearly expressed. Different points have different meanings according to the extracted isoline, which mainly depends on the information represented by the point data. If the value of the point represents the temperature, then the extracted isoline is the isotherm; if the value of the point represents the rainfall, then the extracted isoline is the isohyet, and so on.
 |
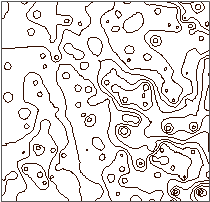 |
| Figure: Point Dataset | Figure: Contours extracted from point data |
Application Example
Open the "Precipitation" Datasource "under the" Exercise Data/RasterAnalysis "folder, where there is precipitation data of meteorological monitoring stations in some regions. We use this data as an example.
Function entrance
- On the Spatial Analysis tab-> Raster Analysis-> Surface Analysis-> Extract lines from point data;
- Toolbox-> Raster Analysis Tools-> Surface Analysis-> Extract Isolines/Areas-> Extract lines from point data. (iDesktopX)
Main parameters
- Source Data
Datasource: The Datasource where the Dataset to be extracted is located.
Dataset: Dataset for contour extraction. After the Datasource of the extraction operation is selected, the system will automatically filter the Dataset and display only the 2D and 3D Point Dataset under the Datasource.
Property Field: Property Field for Interpolation Analysis, generally set as Elevation Field. Interpolation Analysis will be performed on the point data in the Point Dataset with the values in this field when the isoline is extracted.
- Result Data
Datasource: Datasource where the extracted equivalent Line Dataset is to be stored.
Dataset: Extract the Dataset Name to be saved for IsoLines Result. If the entered Dataset Name already exists, you will be prompted with Invalid dataset name and need to re-enter it. Default Dataset Name is: IsoLine.
Maximum Contour: Displays the maximum value of the contour in the Target Dataset.
Minimum Contour: Displays the minimum value of the contour in the Target Dataset.
Number of contours: Displays the total number of contours in the Target Dataset.
- Parameter Settings
Interpolation Type: If the Source Dataset is 3D Point Dataset, you can select one of IDW, Kriging, or TIN to interpolate the data.
- IDW is a simple and effective data interpolation method, which calculates the average value of discrete points in the nearby area to estimate the value of the cell.
- Kriging has the same idea as the Ordinary Kriging interpolation method, and its data structure is simple, so it is very suitable for the construction of macro-terrain in large areas.
- TIN needs to generate a TIN model from the given Line Dataset, and then generate the terrain according to the given extreme point information (optional) and lake information (optional). The TIN model can reflect the terrain characteristics well, but the data results are complex, so it is suitable for the calculation of small area terrain.
Resolution: The resolution of the intermediate result (Raster Dataset) of Interpolation Analysis on Point Dataset. When the interpolation type is TIN, the resolution is not settable.
Reference value: The initial starting value when the contour line is generated. It is calculated in the forward or forward and backward directions with the contour distance as the interval. Therefore, it is not necessarily the value of the minimum contour line. You can enter any number as the base value. The default value is 0. For example, for DGM data with an elevation range of 220-1550, if you set the base value to 500 and the contour distance to 50, the result of the contour extraction is that the minimum contour value is 250 and the maximum contour value is 1550.
contour distance: the interval value between two contours, which together with the reference value determines which contours are extracted.
- Set parameters such as resampling factor, smoothing method, and Smoothness. See: Public Parameter Description .
- Click the "OK" button to complete the contour extraction operation. Open Result Data in Map to see the isoline Extraction Result, as shown in the following figure:
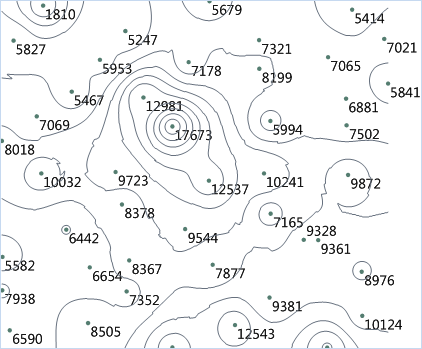 |
| Figure: Point Dataset Extract IsoLines Result |
 Related topics