 Introductions
A diagram and a thematic map can be converted to each other to show data information in different ways.
Convert a diagram to a thematic map
Supports converting a diagram created from a vector dataset to a thematic map. Note: A diagram created from an attribute table can not be converted to a thematic map directly.
Open a diagram. There are two functional entrances:
- Entrance 1: Click on Diagrams tab > Diagram Conversion > Convert to Thematic Map to open the "Convert to Thematic Map" dialog box.
- Entrance 2: Right-click on the current statistic diagram window and select Convert to Thematic Map to pop up the dialog box Convert to Thematic Map.
Set the following parameters in the dialog box.
- Select Map Window: you can select which window to open the resulting thematic map. "New Map Window" means the thematic map will be opened in a new window. Or, you can check other options to open the thematic map in an existing window.
- Select one or more types of thematic maps. Detail instructions are:
- A bar chart, a pie chart, a bubble chart, or a line chart can be converted to a unique thematic map, a gradient thematic map, a statistics thematic map, or a dot density thematic map and vice versa.
- A histogram and a thematic map can be converted to each other.
- Converting a scatter plot, a time series diagram or a combo diagram to a thematic map is not allowed.
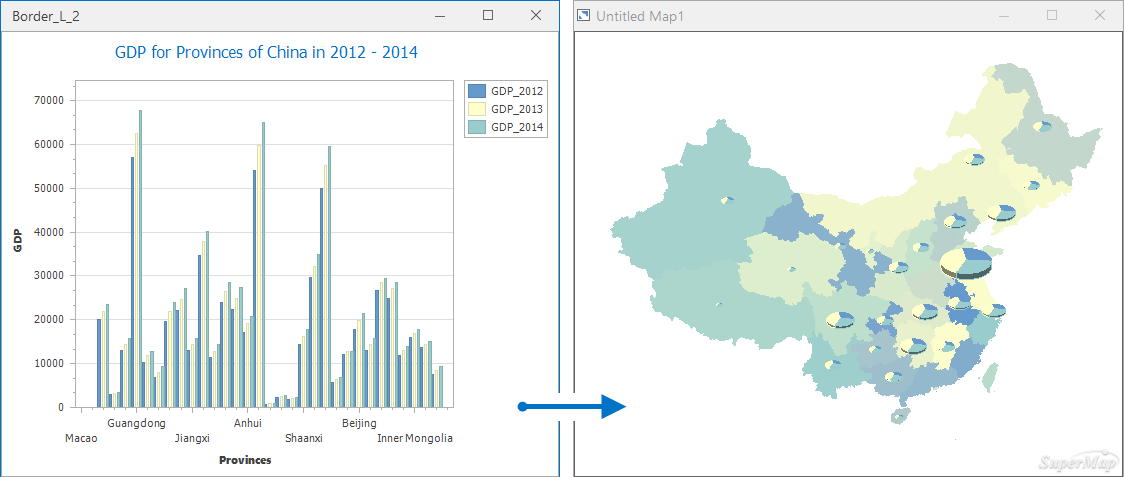
Instance: the following picture shows the conversion from a column chart to a statistic thematic map.
 |
| Figure: Conversion result |
Convert a thematic map to a statistic diagram
Your thematic map can be converted to a statistic graph.
Function Entrances
Right click a thematic map in the Layer Manager and select the Convert to Diagram button to open the Convert to Diagram dialog box.
Set the following parameters in the dialog box:
- Select Map Window: In the Select Diagram Window area, set the display way for your diagram (open it on a new window or on the current existing graph window).
- Select one type of thematic map. The supported conversion types include:
- A unique map, a statistics map, a gradient symbol map, or a dot density map can be converted to a bar chart, a pie chart, a line chart, or a bubble chart and vice versa.
- Support conversions between range thematic maps and histograms.
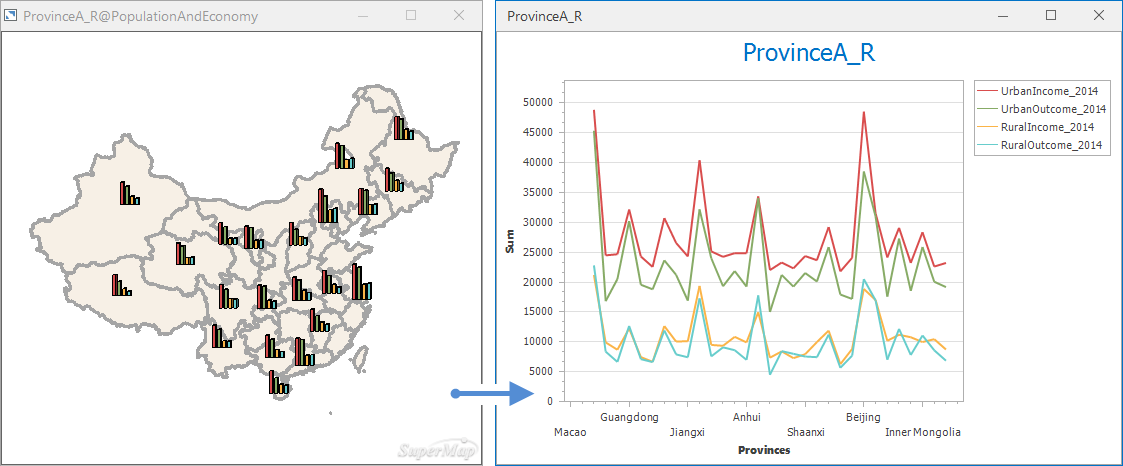
Instance: the following pictures shows the conversion from the 2014 per-capita income of urban and rural residents thematic map to a line chart.
 |
| Figure: Conversion result |
 Related Topics