Big data is getting bigger nowadays. Therefore, we desire a new technology with a strong ability to analyze big data, that is where data mining comes in. The new technology is the process of analyzing big data information and discovering trends and patterns.
A diagram is a graphic representation that shows and mine relations, distribution, trends, and patterns of data. We can create different types of diagrams to research relations of data and dig useful information.
SuperMap iDesktop supports creating different types of diagram based on data attribute information.
With SuperMap iDesktop, you can perform the following operations.
- Creating various digrams including column, pie, line, bubble, combo, scatter, time series, histogram, bar, donut, and area diagrams.
- SuperMap iDesktop supports the conversion between a thematic map and a diagram to represent data in different ways.
- You can associate your diagram and map with attribute information to view different displays of data at the same time.
- You can export a diagram as an image for further use.
- You can use a predefined template to create a diagram or export your diagram as a template for further use.
- Besides, you can add your diagram to a layout or a dashboard.
Instances
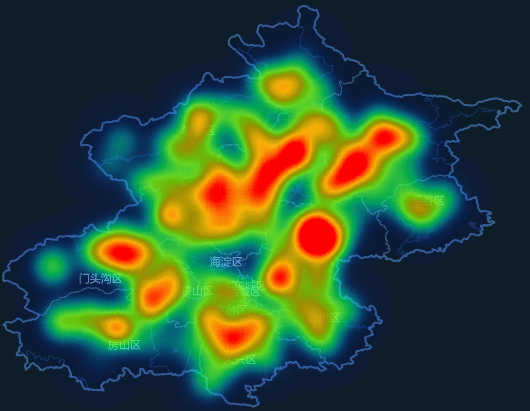
The following map shows the traffic jam situation of Beijing in the morning rush hour. From the map, we can roughly know about where the hot areas and cold areas are.
 |
| Figure: the traffic jam heat map |
To mine more information, we created several different types of diagrams to represent traffic jam situation. From these diagrams, we can get more specific information which can help traffic administrative departments to make decision on traffic improvements.
 |
| Figure: diagrams for data mining |
 Related Topics
 Conversion between a diagram and a thematic map