


Display Control
The Display Control group organizes common parameters for layer properties. For details, please refer to Setting Common Layer Properties.
Special Value
- Special Value: You can click the pick button to select a pixel value from the image layer in the map as the special value (with snapping support), or directly input a numerical value. This allows users to set display effects for raster cells with specific values.
- Special Value Transparency: This checkbox determines whether specified raster values will be displayed transparently. When checked, cells with specified values become transparent; when unchecked, they retain their assigned colors.
Background Value
Replace the color of specified background value cells with another color.
- Background Value: You can click the pick button to select a pixel value from the image layer in the map as the background value (with snapping support), or directly input a numerical value.
- Background Value Transparency: Click the drop-down button to set replacement color in the color palette.
Transparent Color
Transparent color settings allow making specific color ranges in raster layers transparent. Complete transparent color configuration requires combined use of Transparent Color and Transparency Tolerance commands.
- Transparent Color: When checked, specified no-data cells become transparent; when unchecked, they retain their assigned colors.
- Transparency Tolerance: After setting tolerance value (a), colors requiring transparent display will range from (r-a, g-a, b-a) to (r+a, g+a, b+a) based on original color (r, g, b).
Brightness
For raster layers, the Brightness numeric control adjusts layer brightness. Users can directly input values or use mouse slider for real-time adjustments.
Contrast
For raster layers, the Contrast numeric control adjusts layer contrast. Users can directly input values or use mouse slider for real-time adjustments.
Interpolation Method
When zooming raster data, SuperMap provides 5 interpolation methods: Nearest Neighbor, Low Quality, High Quality, High Quality Bilinear, and High Quality Bicubic. Higher quality methods require longer processing time.
- Nearest Neighbor: Simplest method with fastest processing but poorest display quality.
- Low Quality: Performs pre-filtering for quality reduction but poor enlargement results.
- High Quality: Better display quality during scaling with longer processing time.
- High Quality Bilinear: Uses bilinear interpolation with pre-filtering for high-quality scaled display.
- High Quality Bicubic: Uses bicubic interpolation with pre-filtering for highest quality output.
Display Method
Provides three modes: Default, Stretch Display, and Grid Function Display.
- Default: Displays data using grayscale values.
- Stretch Display: Default is No stretching. For more methods, see Image Stretching Methods.
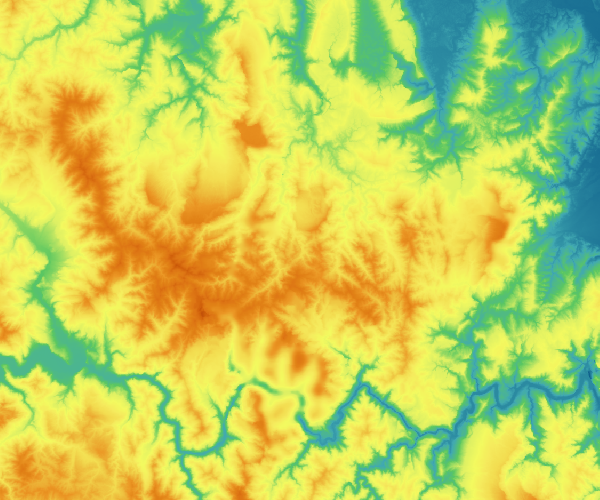
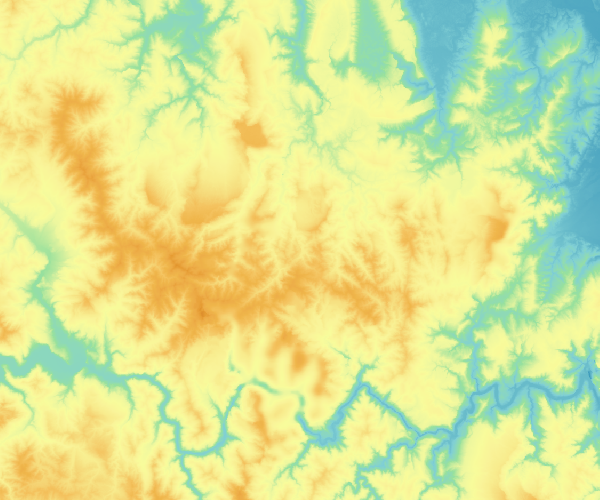
- Grid Function Display: Offers five display modes: 3D Hillshade, 3D Orthophoto, Slope, Aspect, and Viewshed.
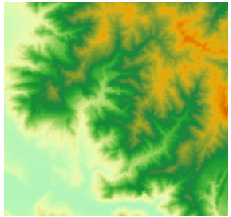
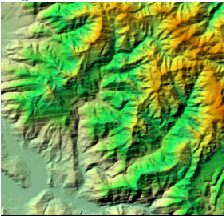
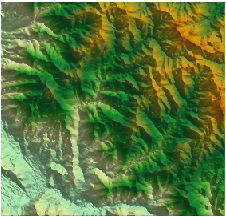
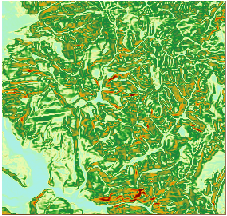
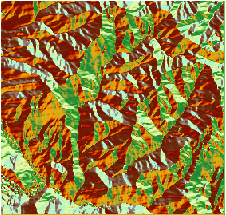
Default display 3D Orthophoto 3D Hillshade Slope map Aspect map Viewshed - 3D Orthophoto: Digital differential correction technique using neighboring elevation data for image rectification.
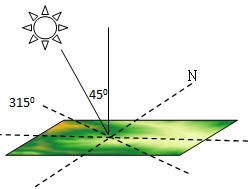
- 3D Hillshade: Simulates terrain relief through virtual lighting. Sun-facing slopes appear brighter while shaded areas darker.
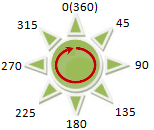
- Light Azimuth: Defines light direction (default: 315, range: [0,360], unit: deg). 0=North, 90=East, 180=South, 270=West.
- Light Altitude: Sets light inclination (default: 45, range: [0,90], unit: deg). 0=horizontal, 90=vertical.
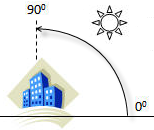
When azimuth=315° and altitude=45°, the lighting relationship is shown below.
- Elevation Scaling Factor: When elevation units (Z) differ from X/Y coordinates, multiply elevation values by this factor. Example: X/Y in meters vs Z in feet requires factor=0.3048. Value=1 means no scaling.
Recommended practice: Convert data to projected coordinate system (meters). For geographic coordinates, use appropriate scaling factors:
   Latitude     Z-factor
       0         0.00000898
      10         0.00000912
      20         0.00000956
      30         0.00001036
      40         0.00001171
      50         0.00001395
      60         0.00001792
      70         0.00002619
      80         0.00005156
- Light Azimuth: Defines light direction (default: 315, range: [0,360], unit: deg). 0=North, 90=East, 180=South, 270=West.
- Slope: Displays calculated slope values. Defaults: azimuth=315°, altitude=45°, scaling=1 (azimuth unmodifiable).
- Aspect: Displays calculated aspect values. Default parameters unmodifiable.
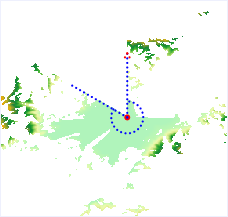
- Viewshed: Defines visible areas from observation points.
- X Coordinate: Observer's X coordinate, obtainable via map picker.
- Y Coordinate: Automatically populated after X selection.
- Altitude: Observer's elevation value, auto-filled with coordinates.
 Tip:
Tip:Use Clear button next to Y coordinate to reset all position values.
- Visible Region Value: Input raster values corresponding to color table entries for visibility display. Click settings button to configure colors and values.
- Start Angle: Sets initial viewing angle (0°=North). E.g., 90=East.
- View Angle: Defines clockwise viewing range from start angle (default: 360°, unit: deg). E.g., start=90° + angle=30° creates 90-120° range.
Gamma
Gamma parameter enables non-linear brightness/contrast adjustments for enhanced display details. Range: 0-10 (inclusive), precision: two decimal places.
Not available in Grid Function Display mode. Gamma effects:
- Gamma=1: No correction applied
- Gamma>1: Enhances dark areas (brightens image), reduces highlight details
- Gamma<1: Enhances bright areas (darkens image), reduces shadow details
 |
 |
| Figure 1: Gamma=1 | Figure 2: Gamma=2 |
Color Map
Configures raster cell colors. Click Settings... to edit in Color Map dialog.
Automatic Interpolation of the Color Chart
When checked, performs raster resampling to smooth cell boundaries for better color transitions.
Related Topics
Setting Common Layer Properties
Setting Vector Layer Properties
Setting Image Layer Properties