


Feature Description
Planar accuracy evaluation is used to detect error distribution in image planar accuracy or edge matching accuracy. Planar accuracy refers to the root-mean-square error (RMSE) of plane positions in digital orthophoto maps (DOM), while edge matching accuracy refers to the edge-matching positional root-mean-square error (RMSE) between DOMs and adjacent images.
Through planar accuracy evaluation, users can not only understand the error distribution characteristics of imagery, but also determine whether it meets actual production accuracy requirements. This provides critical basis for imagery quality control and application.
SuperMap ImageX Pro 11i(2024) version and later support this feature.
Feature Entry
Imagery tab->Quality Assessment group->Plane Accuracy.
Parameter Description
- Accuracy Evaluation Type: Three options available: Planar accuracy and edge matching accuracy, Plane accuracy, and Edge matching accuracy.
- Planar accuracy and edge matching accuracy: Outputs both planar correction accuracy report and edge matching accuracy report.
- Plane Accuracy: Outputs planar correction accuracy report only.
- Edge matching accuracy: Outputs edge matching accuracy report only.
- Image to be checked: Input mosaic dataset containing imagery to be inspected. Default selection is orthoimagery in mosaic dataset. If unavailable, selects first image in dataset. Provide four ways to input image files: adding files, adding folders, adding lists, and adding embedded data. When selecting to add a folder, all image files in that folder (including subfolders) will be automatically retrieved.
- Reference image: Input mosaic dataset containing reference data, typically panchromatic and multispectral reference imagery. Provide four ways to input image files: adding files, adding folders, adding lists, and adding embedded data. When selecting to add a folder, all image files in that folder (including subfolders) will be automatically retrieved.
- Checkpoint Parameters:
- Single-scene seed points: Sets number of seed points generated on single-scene images. Default: 1000. Actual detection results may be fewer than set value.
- Edge seed points: Sets number of seed points generated in image overlap areas. Default: 1000. Actual detection results may be fewer than set value.
- Search distance: Sets search radius for image matching seed points. Range: [0, 256], default: 40 px. Larger radius increases matching scope and processing time.
- Residual threshold: Sets residual threshold for checkpoints. Range: [0, 40], default: 5 px. Higher threshold retains more reference points but increases error probability.
- Error unit: Unit for planar accuracy tolerance and edge matching accuracy tolerance. Options: px, m, deg. Default: px.
- Plane accuracy tolerance: Evaluates checkpoint quality by counting points within tolerance (<1×), 1-2× tolerance, and >2× tolerance based on overall RMSE. Default: 5. Adjust per project acceptance criteria.
- Edge matching accuracy tolerance: Evaluates edge checkpoints using same method as above. Default: 5. Adjust per project requirements.
- Exclude building area points: When checked, automatically detects building areas in imagery and excludes checkpoints within them.
- Status:
- Output coordinate system: Set the coordinate system for the output result surface dataset and checkpoints, making it easy to overlay and display with other data. The default is GCS_WGS_1984.
- Report directory: Sets output directory for quality reports. Planar accuracy QC report name: QualityReport.html; Edge matching accuracy QC report name: QualityReport_Edge.html.
- Export to Excel: When checked, reports export as Excel files. Unchecked outputs HTML by default.
Taking planar accuracy QC report as example, contents include:
- Overall QC report: Provides statistical summary of all checkpoints in inspected area.

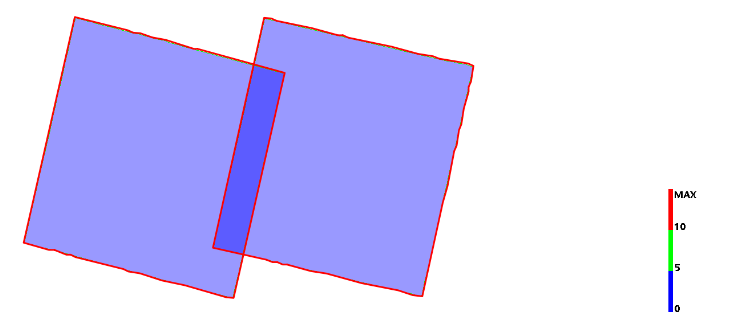
- Quality control result map: Visualizes error distribution using color grading. Example shows all objects within 0-5 tolerance range meeting accuracy requirements.
- Single-scene QC report: Statistics per image scene with zonal checkpoint error calculation.
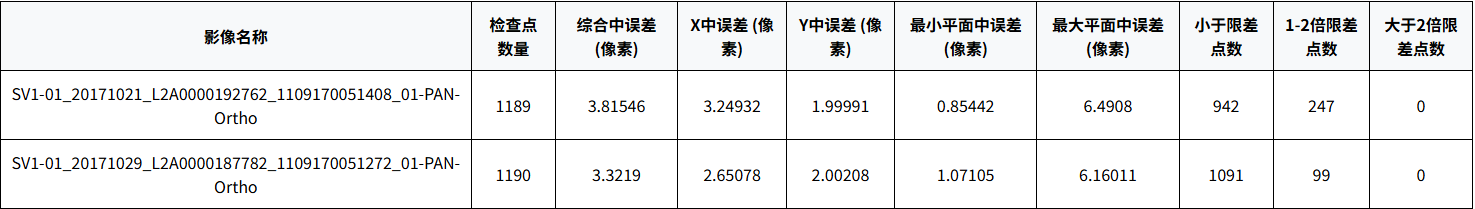
- Checkpoint QC report: Extracts each row from single-scene report and displays checkpoint errors below table.

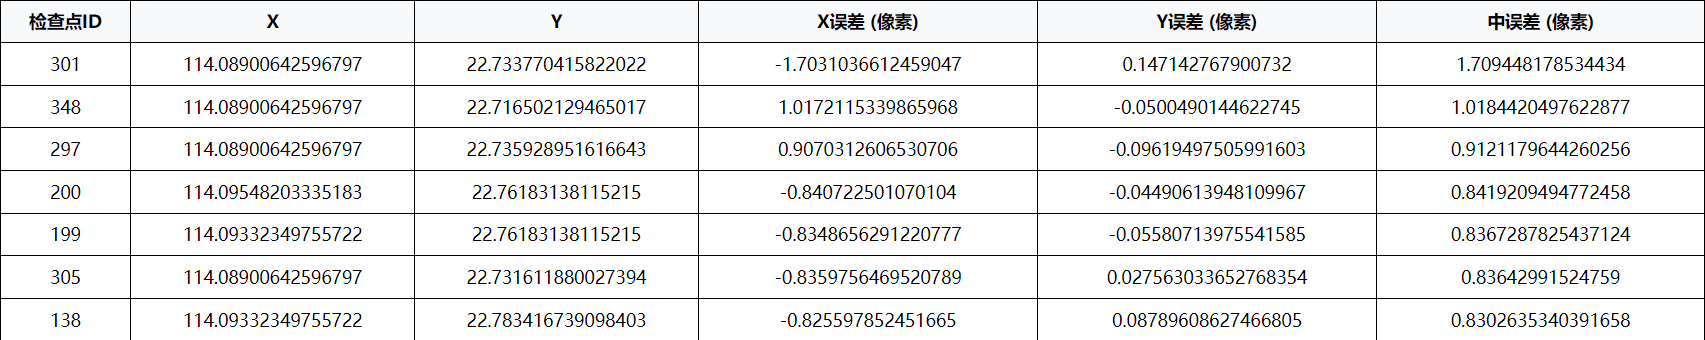
- Checkpoint error: Displays detailed checkpoint information for each single-scene image (partial example shown).
- Overall QC report: Provides statistical summary of all checkpoints in inspected area.
Related Topics