iTablet provides 10 modules for data collection, processing, and management. Besides, it docks with SuperMap Online (hereinafter referred to as Online) and SuperMap iPortal (hereinafter referred to as Online). Therefore, you can log in any one of them to upload and download your data. This article introduces the 10 modules that the app provides.
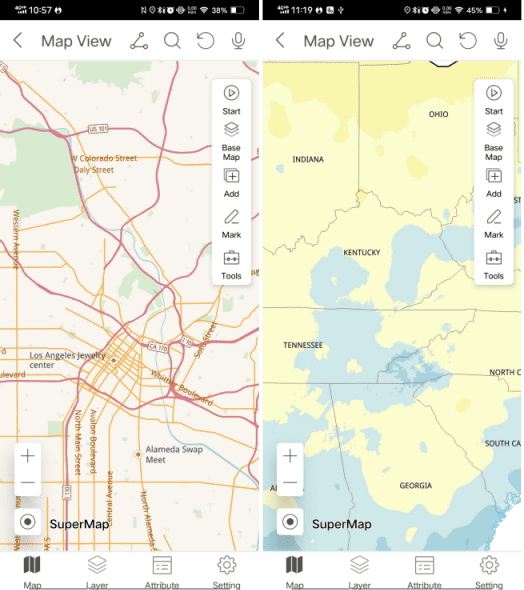
Map View
You can browse local/online maps, label points, lines, regions, and text on your maps, modify labeling objects, and measure areas, distances, and angles.
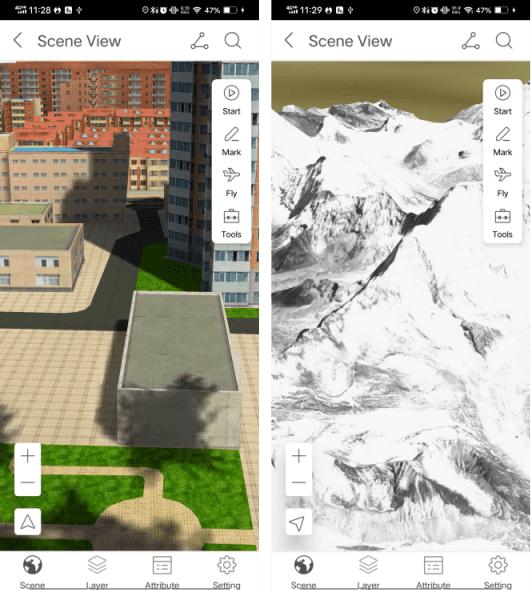
Scene View
You can display and browse various 3D data (models, DEM data, oblique photography data, point cloud data, etc.) and load 3D online scene. It allows you to browse, create, and edit the flying routes. It provides the ability of 3D analyses like 3D path analysis, 3D measurement, and Box clip.
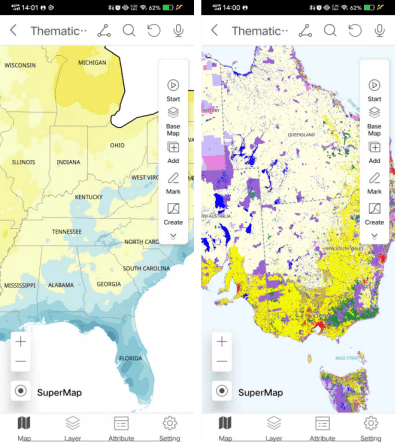
Thematic Map
You can create more than 20 kinds of thematic maps with your fingers conveniently. The app provides dozens of color schemes for style settings and supports generating legends. You are allowed to adjust styles, column counts, widths, and heights of legends.
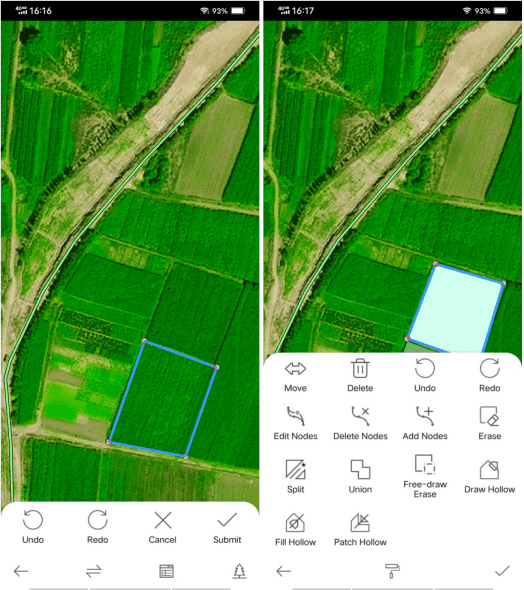
Surveying
It supports multiple collection methods, such as, dot drawing by satellite positioning, manual dot drawing, and gesture drawing. After data collection, you can process data like splitting lines and cutting regions. The app can create attribute tables to save the collected attributes of data. Besides, it supports multimedia collection such as pictures and videos and templated collection which can loads templates for configuring map layers, styles, dataset attribute fields, etc.
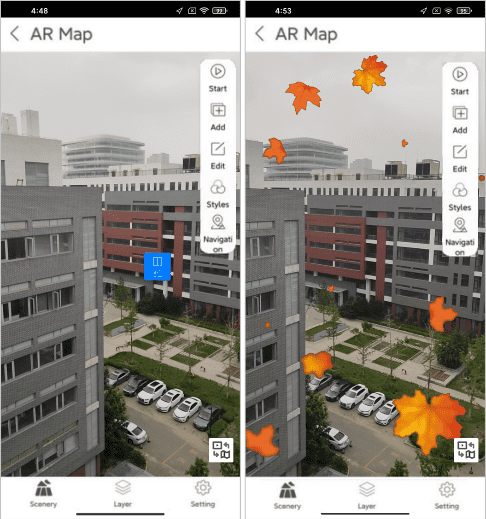
AR Map
Overlay spatial information and multimedia information in the real scene to achieve the effect of augmented reality, including adding pictures, videos, web pages, texts, special effects, 3D models, etc. After adding these information, you can set their attributes such as position and size, and adjust the position of the content in the scene.
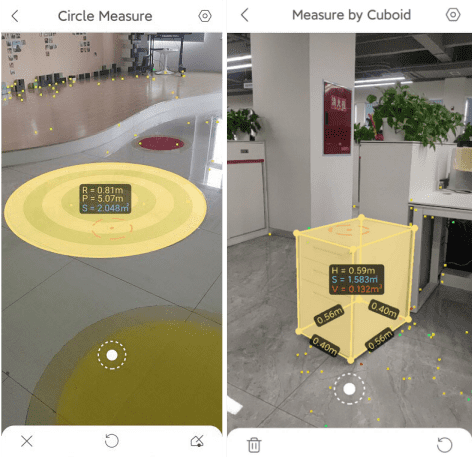
AR Survey
AR Survey, including AR Measurement and AR Mapping two parts. AR Measurement allows you to use mobile devices to directly measure distance, height, area, volume, and angle, and display the results instantly. AR Mapping collects points, lines, surfaces, etc. through trajectories, dots, or point clouds, and the collection results can be used to make maps.
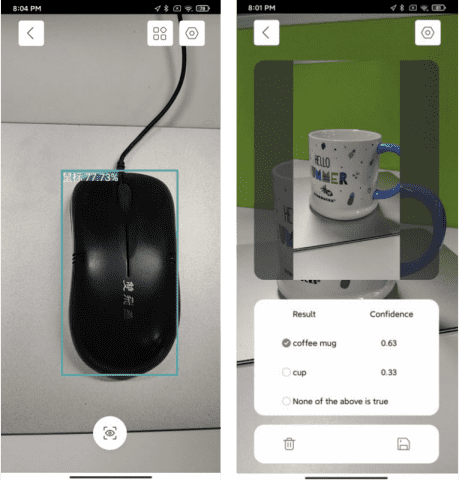
AR Analysis
Combining AR, AI, and maps, the app can intelligently identify ground objects according to the training model. It provides identification methods such as target recognition, target classification, target aggregation, and vehicle collection, and supports loading user models.
Navigation
Navigation supports loading navigation data that contains road network to perform path analysis and navigation, and voice guidance throughout the whole navigation process. It supports both indoor navigation and outdoor navigation. You are allowed to edit and compile road network, quickly update road network, saving the cost and time of data production.
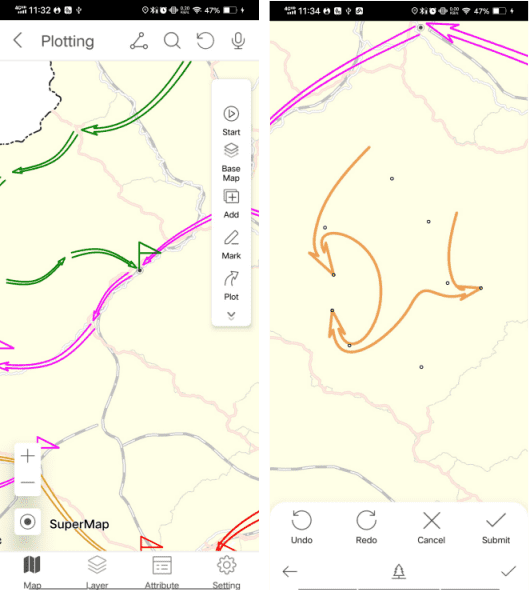
Plotting
Plotting assists emergency dispatch and command. It supports a variety of plotting templates. You can import and use various plotting libraries made on iDesktopX, such as symbols for firefighting, police, urban management, fishery and other fields. More than 1200 plotting symbols are predefined. You can modify symbols and create evolution animations with custom animation type, start and duration, and playback order. The animation types include blinking, properties, showing/hiding, growth, rotation, and scale. It allows to export animations to xml format.
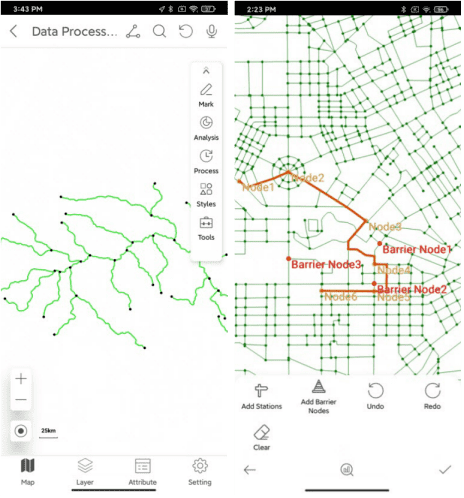
Data Processing
Perform online or offline analysis on vector or raster data. Among them, network analysis includes path analysis, connectivity analysis, and traveling salesman analysis. Vector analysis includes buffer analysis, overlay analysis, and Thiessen polygons. And raster analysis includes interpolation analysis. Docking SuperMap iServer, it provides various online analyses. At the same time, it supports data registration and projection transformation.
