


In the 2D Plotting Panel, you can plot common symbols such as standard symbols, police symbols, or primitives like polylines, circles, annotations, etc.
instructions for use
2D Markup only supports adding symbols and primitive objects to CAD layers, and the projection of the CAD Dataset must be WGS 1984.
Operation Steps
The 2D Plotting Panel provides display and plotting of point symbols, line and region symbols, and primitives on the map. The specific steps for plotting symbols are as follows:
- Create a new CAD Dataset and add it to the corresponding map, then set the CAD layer to editable state.
- In the "2D Markup" tab, in the "Markup Panel" group, click "Markup Panel", and the "2D Plotting Panel" dialog box pops up. The 2D Plotting Panel is divided into two pages: "Symbols" and "Primitives". The "Symbols" page contains various predefined symbol symbols by the system, and the "Primitives" page contains commonly used graphic objects such as polylines, parallelograms, circles, ellipses, etc.
- Plot symbols on the map. The Markup Panel provides two types of symbols: one is point symbols such as squares, house numbers, personnel, etc., and the other is line and region symbols such as single arrow, double arrow, multiple arrows, etc. Select the symbol to plot in the Markup Panel, then click directly at the location on the map where you want to plot it, and the symbol will be plotted, as shown in the figure below.
 |
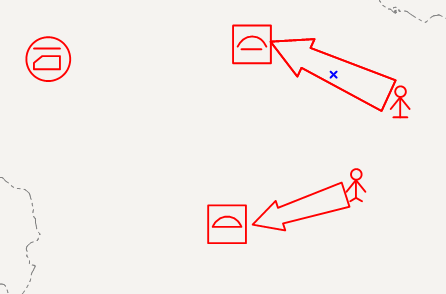 |
| Figure: Point Symbol Illustration | Figure: Line and Region Symbols Illustration |
Note that when plotting line and region symbols, you need to click multiple locations. Line and region symbols have two ways to end plotting: one is when plotting reaches the maximum number of points, for example, for a two-point line and region symbol, when the left mouse button clicks two points, the symbol plotting ends; the other is when plotting has not reached the maximum point count, right-click to end the plotting of the line and region symbols.
 Related Topics